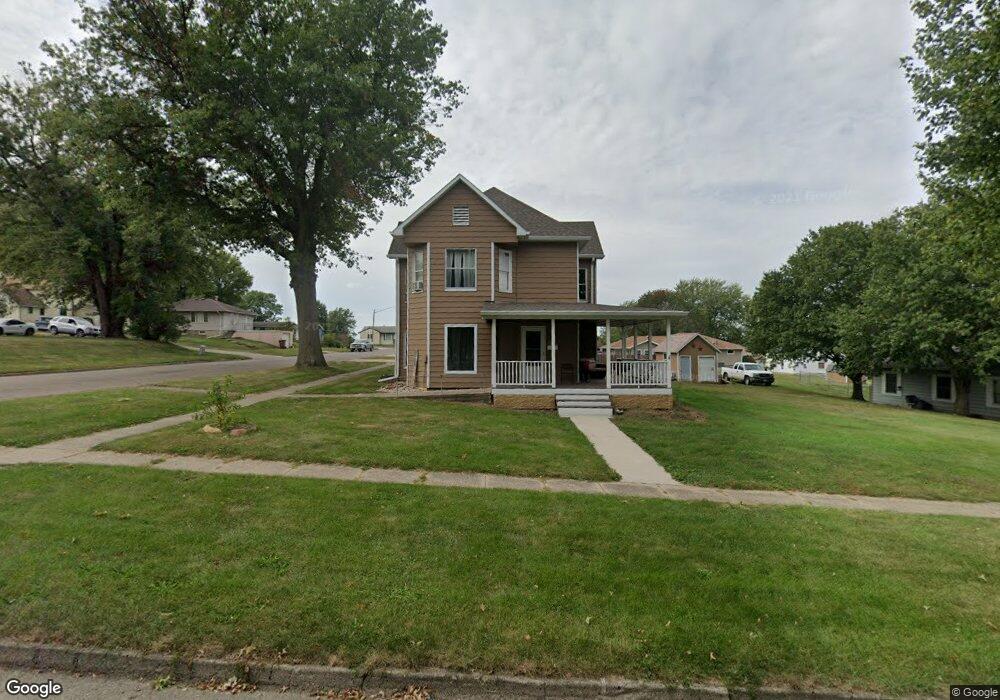
1023 Main St Manning, IA 51455
Estimated Value: $143,000 - $152,343
3
Beds
1
Bath
1,666
Sq Ft
$88/Sq Ft
Est. Value
About This Home
This home is located at 1023 Main St, Manning, IA 51455 and is currently estimated at $146,336, approximately $87 per square foot. 1023 Main St is a home with nearby schools including Ikm-Manning High School, IKM-Manning Middle School, and Irwin Elementary School.
Ownership History
Date
Name
Owned For
Owner Type
Purchase Details
Closed on
Feb 16, 2016
Sold by
Vinke Gale G and Vinke Linda L
Bought by
Chapman Dennis R and Chapman Michaela A
Current Estimated Value
Home Financials for this Owner
Home Financials are based on the most recent Mortgage that was taken out on this home.
Original Mortgage
$64,500
Interest Rate
3.97%
Mortgage Type
Future Advance Clause Open End Mortgage
Purchase Details
Closed on
Apr 14, 2005
Sold by
Christensen Mervin W and Christensen Sondra L
Bought by
Stangl Renee and Christensen Michael
Create a Home Valuation Report for This Property
The Home Valuation Report is an in-depth analysis detailing your home's value as well as a comparison with similar homes in the area
Home Values in the Area
Average Home Value in this Area
Purchase History
| Date | Buyer | Sale Price | Title Company |
|---|---|---|---|
| Chapman Dennis R | $64,000 | None Available | |
| Stangl Renee | -- | None Available |
Source: Public Records
Mortgage History
| Date | Status | Borrower | Loan Amount |
|---|---|---|---|
| Closed | Chapman Dennis R | $64,500 |
Source: Public Records
Tax History Compared to Growth
Tax History
| Year | Tax Paid | Tax Assessment Tax Assessment Total Assessment is a certain percentage of the fair market value that is determined by local assessors to be the total taxable value of land and additions on the property. | Land | Improvement |
|---|---|---|---|---|
| 2025 | $1,450 | $118,420 | $15,630 | $102,790 |
| 2024 | $1,384 | $98,630 | $15,630 | $83,000 |
| 2023 | $818 | $98,630 | $15,630 | $83,000 |
| 2022 | $806 | $49,020 | $12,690 | $36,330 |
| 2021 | $806 | $49,020 | $12,690 | $36,330 |
| 2020 | $820 | $49,020 | $12,690 | $36,330 |
| 2019 | $838 | $49,020 | $12,690 | $36,330 |
| 2018 | $764 | $49,020 | $12,690 | $36,330 |
| 2017 | $764 | $45,989 | $9,962 | $36,027 |
| 2016 | $714 | $42,980 | $0 | $0 |
| 2015 | $714 | $39,700 | $0 | $0 |
| 2014 | $664 | $39,700 | $0 | $0 |
Source: Public Records
Map
Nearby Homes