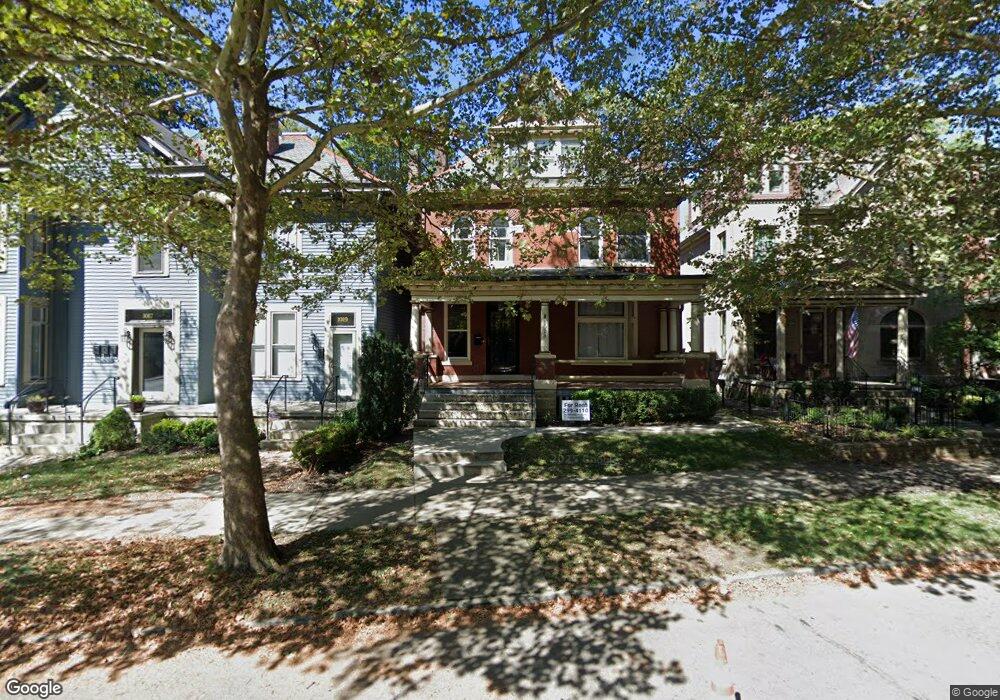
1023 Neil Ave Columbus, OH 43201
Victorian Village NeighborhoodEstimated Value: $602,000 - $798,000
4
Beds
2
Baths
2,740
Sq Ft
$260/Sq Ft
Est. Value
About This Home
This home is located at 1023 Neil Ave, Columbus, OH 43201 and is currently estimated at $712,886, approximately $260 per square foot. 1023 Neil Ave is a home located in Franklin County with nearby schools including Hubbard Elementary School, Dominion Middle School, and Whetstone High School.
Ownership History
Date
Name
Owned For
Owner Type
Purchase Details
Closed on
May 4, 2015
Sold by
Fink Andrew B and Arcara Kristina A
Bought by
1023 Neil Ave Llc
Current Estimated Value
Home Financials for this Owner
Home Financials are based on the most recent Mortgage that was taken out on this home.
Original Mortgage
$335,025
Outstanding Balance
$258,091
Interest Rate
3.68%
Mortgage Type
Purchase Money Mortgage
Estimated Equity
$454,795
Purchase Details
Closed on
Sep 8, 2003
Sold by
Newkirk Ernest M
Bought by
Fink Andrew B and Arcara Kristina A
Home Financials for this Owner
Home Financials are based on the most recent Mortgage that was taken out on this home.
Original Mortgage
$228,000
Interest Rate
4.75%
Mortgage Type
Purchase Money Mortgage
Purchase Details
Closed on
Jul 14, 1960
Bought by
Cypress Margie A
Create a Home Valuation Report for This Property
The Home Valuation Report is an in-depth analysis detailing your home's value as well as a comparison with similar homes in the area
Home Values in the Area
Average Home Value in this Area
Purchase History
| Date | Buyer | Sale Price | Title Company |
|---|---|---|---|
| 1023 Neil Ave Llc | -- | None Available | |
| Fink Andrew B | $240,000 | The Title Company Ltd | |
| Cypress Margie A | -- | -- |
Source: Public Records
Mortgage History
| Date | Status | Borrower | Loan Amount |
|---|---|---|---|
| Open | 1023 Neil Ave Llc | $335,025 | |
| Previous Owner | Fink Andrew B | $228,000 |
Source: Public Records
Tax History Compared to Growth
Tax History
| Year | Tax Paid | Tax Assessment Tax Assessment Total Assessment is a certain percentage of the fair market value that is determined by local assessors to be the total taxable value of land and additions on the property. | Land | Improvement |
|---|---|---|---|---|
| 2024 | $9,149 | $199,640 | $77,000 | $122,640 |
| 2023 | $9,035 | $199,640 | $77,000 | $122,640 |
| 2022 | $10,883 | $204,790 | $35,070 | $169,720 |
| 2021 | $10,903 | $204,790 | $35,070 | $169,720 |
| 2020 | $10,919 | $204,790 | $35,070 | $169,720 |
| 2019 | $10,595 | $170,390 | $29,230 | $141,160 |
| 2018 | $9,160 | $170,390 | $29,230 | $141,160 |
| 2017 | $10,593 | $170,390 | $29,230 | $141,160 |
| 2016 | $8,504 | $125,170 | $28,320 | $96,850 |
| 2015 | $7,742 | $125,170 | $28,320 | $96,850 |
| 2014 | $7,761 | $125,170 | $28,320 | $96,850 |
| 2013 | -- | $125,370 | $25,725 | $99,645 |
Source: Public Records
Map
Nearby Homes
- 319 W 2nd Ave Unit 319
- 994 Harrison Ave
- 337 Tappan St
- 1018 Neil Ave
- 1016 Neil Ave
- 1042 Neil Ave
- 313 W 1st Ave
- 986 Highland St
- 1003 Pennsylvania Ave Unit 5
- 969 Hunter Ave
- 1025 Hunter Ave
- 867-871 Delaware Ave
- 884 Neil Ave
- 938 Hunter Ave
- 998 Ewing Alley Unit 998
- 162 E 2nd Ave
- 475 W 2nd Ave
- 1001 Dennison Ave
- 915 Dennison Ave Unit 915
- 496 W 1st Ave
- 1027 Neil Ave
- 294 W 2nd Ave
- 298 W 2nd Ave
- 1017 Neil Ave
- 1029 Neil Ave
- 302 W 2nd Ave Unit 304
- 304 W 2nd Ave
- 1037 Neil Ave Unit D
- 1037 Neil Ave Unit B
- 1037 Neil Ave Unit A
- 1037 Neil Ave Unit Suite B
- 1037 Neil Ave
- 308 W 2nd Ave
- 586 W 2nd Ave
- 295 W 2nd Ave
- 312 W 2nd Ave Unit 314
- 1043 Neil Ave Unit 45
- 297 W 2nd Ave Unit 299
- 295 Tappan St
- 301 W 2nd Ave