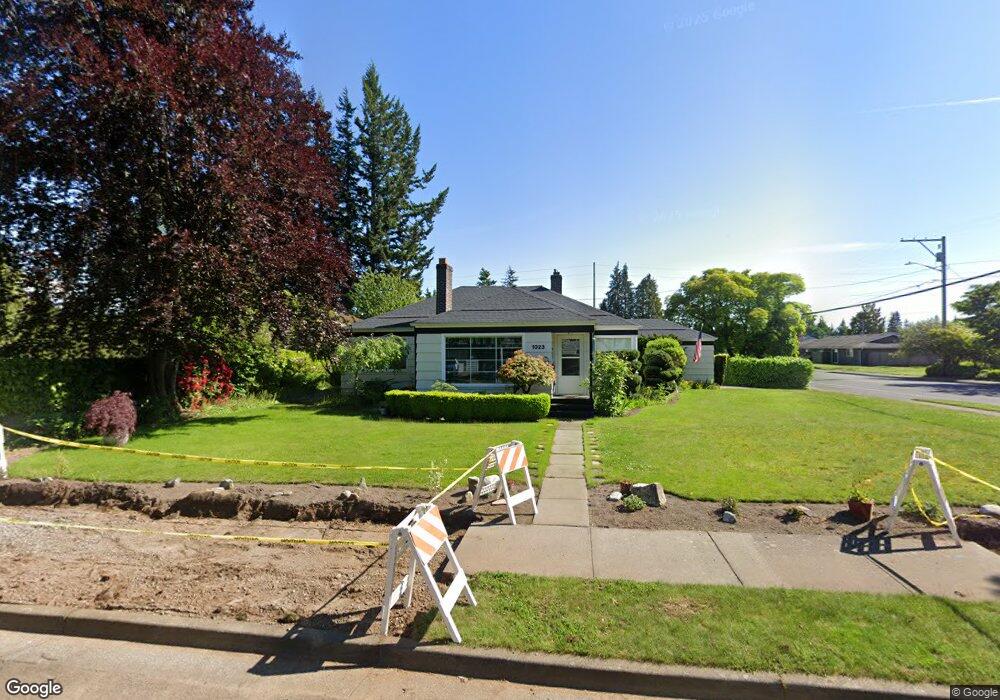
1023 Pine St Lynden, WA 98264
Estimated Value: $519,749 - $582,000
2
Beds
2
Baths
1,276
Sq Ft
$443/Sq Ft
Est. Value
About This Home
This home is located at 1023 Pine St, Lynden, WA 98264 and is currently estimated at $564,937, approximately $442 per square foot. 1023 Pine St is a home located in Whatcom County with nearby schools including Lynden High School, Lynden Christian School, and Lynden Christian Schools: Administration.
Ownership History
Date
Name
Owned For
Owner Type
Purchase Details
Closed on
Nov 18, 2020
Sold by
Williams Richard S
Bought by
Williams Richard S and Williams Paula
Current Estimated Value
Home Financials for this Owner
Home Financials are based on the most recent Mortgage that was taken out on this home.
Original Mortgage
$290,200
Outstanding Balance
$258,237
Interest Rate
2.8%
Mortgage Type
New Conventional
Estimated Equity
$306,700
Purchase Details
Closed on
Jul 26, 2017
Sold by
Stap Kenneth J and Stap Sharon L
Bought by
Williams Richard S and Williams Paula
Home Financials for this Owner
Home Financials are based on the most recent Mortgage that was taken out on this home.
Original Mortgage
$305,000
Interest Rate
3.91%
Mortgage Type
New Conventional
Create a Home Valuation Report for This Property
The Home Valuation Report is an in-depth analysis detailing your home's value as well as a comparison with similar homes in the area
Home Values in the Area
Average Home Value in this Area
Purchase History
| Date | Buyer | Sale Price | Title Company |
|---|---|---|---|
| Williams Richard S | -- | Whatcom Land Title Co Inc | |
| Williams Richard S | $346,000 | Whatcom Land Title Co Inc |
Source: Public Records
Mortgage History
| Date | Status | Borrower | Loan Amount |
|---|---|---|---|
| Open | Williams Richard S | $290,200 | |
| Previous Owner | Williams Richard S | $305,000 |
Source: Public Records
Tax History
| Year | Tax Paid | Tax Assessment Tax Assessment Total Assessment is a certain percentage of the fair market value that is determined by local assessors to be the total taxable value of land and additions on the property. | Land | Improvement |
|---|---|---|---|---|
| 2025 | $3,818 | $530,193 | $300,108 | $230,085 |
| 2024 | $3,614 | $503,951 | $266,750 | $237,201 |
| 2023 | $3,614 | $503,078 | $275,000 | $228,078 |
| 2022 | $2,911 | $382,324 | $144,408 | $237,916 |
| 2021 | $2,855 | $315,966 | $119,344 | $196,622 |
| 2020 | $2,501 | $282,120 | $106,560 | $175,560 |
| 2019 | $2,225 | $258,770 | $97,840 | $160,930 |
| 2018 | $2,432 | $235,969 | $89,128 | $146,841 |
| 2017 | $2,279 | $211,802 | $80,000 | $131,802 |
| 2016 | $2,155 | $211,121 | $77,000 | $134,121 |
| 2015 | $1,910 | $198,614 | $74,060 | $124,554 |
| 2014 | -- | $191,882 | $71,540 | $120,342 |
| 2013 | -- | $190,342 | $70,000 | $120,342 |
Source: Public Records
Map
Nearby Homes
- 8457 Benson Rd
- 410 10th St
- 735 Ivy St
- 802 Edson St
- 902 Captain Bay Ct
- 800 S Park St
- 919 Liberty St
- 0 Guide Meridian Unit NWM2369980
- 805 Cedar Dr
- 1656 Liberty St Unit 101
- 816 Cedar Dr
- 303 Parkside Ct
- 1218 Front St
- 915 Front St
- 8424 Double Ditch Rd
- 301 S Park St
- 1401 E St
- 104 Riverwalk Dr
- 102 Riverwalk Dr
- 108 Fairside Dr Unit 1
Your Personal Tour Guide
Ask me questions while you tour the home.