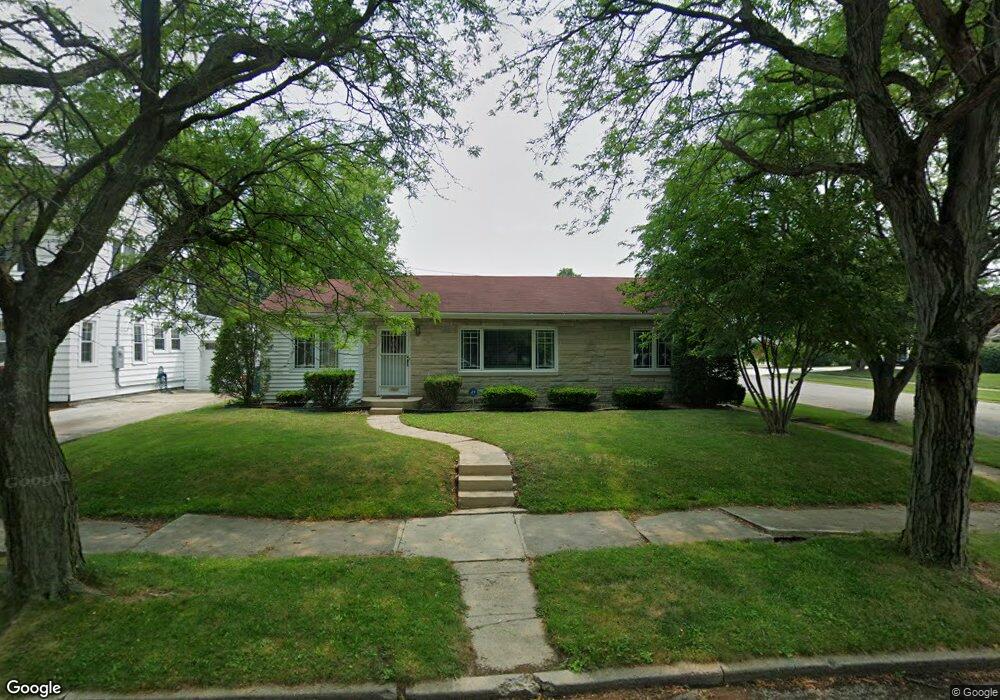
1023 W Euclid Ave Marion, IN 46952
Euclid Triangle NeighborhoodEstimated Value: $164,000 - $172,000
3
Beds
1
Bath
1,821
Sq Ft
$91/Sq Ft
Est. Value
About This Home
This home is located at 1023 W Euclid Ave, Marion, IN 46952 and is currently estimated at $166,411, approximately $91 per square foot. 1023 W Euclid Ave is a home located in Grant County with nearby schools including Riverview Elementary School, Justice Thurgood Marshall Intermediate School, and John L. McCulloch Junior High School.
Ownership History
Date
Name
Owned For
Owner Type
Purchase Details
Closed on
Nov 12, 2019
Sold by
Murrell Marguerite
Bought by
Reese Regan R
Current Estimated Value
Home Financials for this Owner
Home Financials are based on the most recent Mortgage that was taken out on this home.
Original Mortgage
$83,700
Outstanding Balance
$73,634
Interest Rate
3.6%
Mortgage Type
New Conventional
Estimated Equity
$92,777
Create a Home Valuation Report for This Property
The Home Valuation Report is an in-depth analysis detailing your home's value as well as a comparison with similar homes in the area
Home Values in the Area
Average Home Value in this Area
Purchase History
| Date | Buyer | Sale Price | Title Company |
|---|---|---|---|
| Reese Regan R | $93,000 | North American Title Company L |
Source: Public Records
Mortgage History
| Date | Status | Borrower | Loan Amount |
|---|---|---|---|
| Open | Reese Regan R | $83,700 |
Source: Public Records
Tax History Compared to Growth
Tax History
| Year | Tax Paid | Tax Assessment Tax Assessment Total Assessment is a certain percentage of the fair market value that is determined by local assessors to be the total taxable value of land and additions on the property. | Land | Improvement |
|---|---|---|---|---|
| 2024 | $1,272 | $127,200 | $14,300 | $112,900 |
| 2023 | $1,069 | $106,900 | $14,300 | $92,600 |
| 2022 | $909 | $90,900 | $13,500 | $77,400 |
| 2021 | $875 | $87,500 | $13,500 | $74,000 |
| 2020 | $782 | $87,500 | $13,500 | $74,000 |
| 2019 | $730 | $87,100 | $13,500 | $73,600 |
| 2018 | $88 | $87,100 | $13,500 | $73,600 |
| 2017 | $86 | $82,900 | $13,500 | $69,400 |
| 2016 | $84 | $82,900 | $13,500 | $69,400 |
| 2014 | $81 | $85,500 | $13,500 | $72,000 |
| 2013 | $81 | $84,600 | $13,500 | $71,100 |
Source: Public Records
Map
Nearby Homes
- 1005 W Spencer Ave
- 910 W Spencer Ave
- 0 N 200 E (King) Rd Unit 202517402
- 105 N D St
- 115 S F St
- 1309 W 1st St
- 613 W Spencer Ave
- 602 W Nelson St
- 1436 W Spencer Ave
- 1136 W 3rd St
- 1512 W Spencer Ave
- 1015 W 3rd St
- 939 W 3rd St
- 620 W 3rd St
- 717 W 3rd St
- 417 W Nelson St
- 312 Horace Mann Ct
- 1133 W 4th St
- 413 S Grove St
- 1024 W 5th St
- 1017 W Euclid Ave
- 1007 W Euclid Ave
- 1101 W Euclid Ave
- 1020 W Spencer Ave
- 1016 W Spencer Ave
- 1003 W Euclid Ave
- 1012 W Spencer Ave
- 1103 W Euclid Ave
- 1102 W Spencer Ave
- 1100 W Euclid Ave
- 1020 W Euclid Ave
- 1006 W Spencer Ave
- 1106 W Spencer Ave
- 1001 W Euclid Ave
- 1016 W Euclid Ave
- 1108 W Spencer Ave
- 1111 W Euclid Ave
- 1004 W Spencer Ave
- 1010 W Euclid Ave
- 925 W Euclid Ave