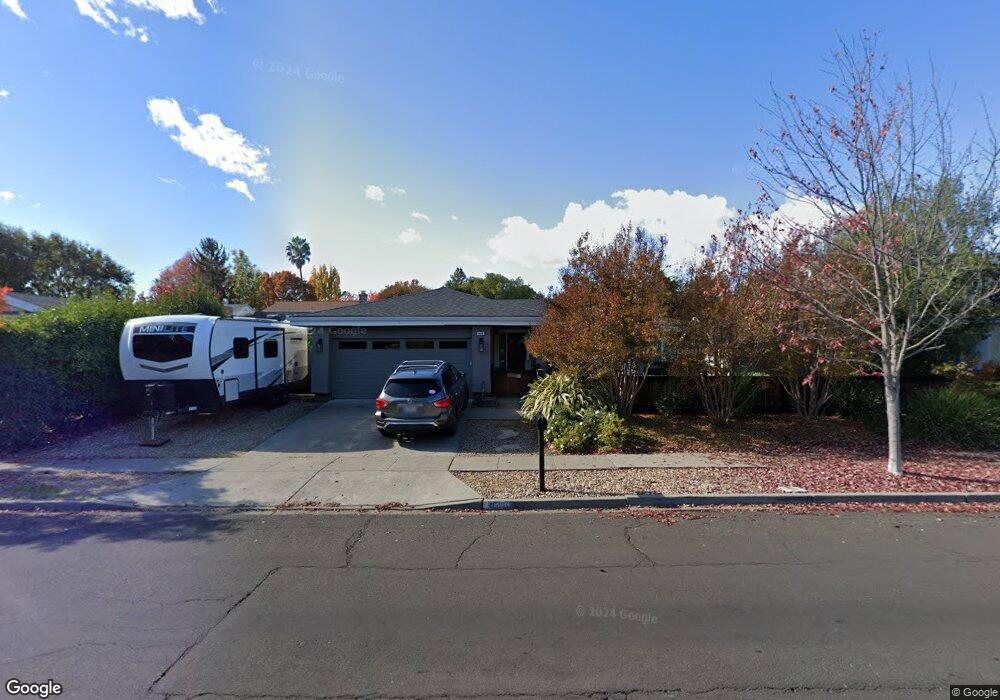
1023 Westview Dr Napa, CA 94558
Browns Valley NeighborhoodEstimated Value: $891,000 - $976,000
3
Beds
2
Baths
1,502
Sq Ft
$611/Sq Ft
Est. Value
About This Home
This home is located at 1023 Westview Dr, Napa, CA 94558 and is currently estimated at $917,226, approximately $610 per square foot. 1023 Westview Dr is a home located in Napa County with nearby schools including Browns Valley Elementary School, Redwood Middle School, and Harvest Middle School.
Ownership History
Date
Name
Owned For
Owner Type
Purchase Details
Closed on
Sep 28, 2018
Sold by
Longaker Robert and Gonzalez Tonya M
Bought by
Gonzalez Edwin and Gonzalez Tonya M
Current Estimated Value
Home Financials for this Owner
Home Financials are based on the most recent Mortgage that was taken out on this home.
Original Mortgage
$265,590
Outstanding Balance
$231,133
Interest Rate
4.5%
Mortgage Type
VA
Estimated Equity
$686,093
Purchase Details
Closed on
Apr 11, 2016
Sold by
Longaker Robert
Bought by
Longaker Robert and Gonzalez Tonya
Purchase Details
Closed on
Oct 24, 2011
Sold by
Watson Marjorie Lee and Knight Ralph L
Bought by
Longaker Robert and Fish Harold J
Home Financials for this Owner
Home Financials are based on the most recent Mortgage that was taken out on this home.
Original Mortgage
$225,000
Interest Rate
4.02%
Mortgage Type
New Conventional
Purchase Details
Closed on
Jan 13, 2006
Sold by
Knight Bessie F
Bought by
Watson Marjorie Lee and Knight Ralph L
Create a Home Valuation Report for This Property
The Home Valuation Report is an in-depth analysis detailing your home's value as well as a comparison with similar homes in the area
Home Values in the Area
Average Home Value in this Area
Purchase History
| Date | Buyer | Sale Price | Title Company |
|---|---|---|---|
| Gonzalez Edwin | -- | Old Republic Title Co | |
| Longaker Robert | -- | None Available | |
| Longaker Robert | $300,000 | Fidelity National Title Co | |
| Watson Marjorie Lee | -- | None Available |
Source: Public Records
Mortgage History
| Date | Status | Borrower | Loan Amount |
|---|---|---|---|
| Open | Gonzalez Edwin | $265,590 | |
| Previous Owner | Longaker Robert | $225,000 |
Source: Public Records
Tax History Compared to Growth
Tax History
| Year | Tax Paid | Tax Assessment Tax Assessment Total Assessment is a certain percentage of the fair market value that is determined by local assessors to be the total taxable value of land and additions on the property. | Land | Improvement |
|---|---|---|---|---|
| 2025 | $4,895 | $376,806 | $200,964 | $175,842 |
| 2024 | $4,895 | $369,419 | $197,024 | $172,395 |
| 2023 | $4,895 | $362,176 | $193,161 | $169,015 |
| 2022 | $4,759 | $355,075 | $189,374 | $165,701 |
| 2021 | $4,697 | $348,113 | $185,661 | $162,452 |
| 2020 | $4,664 | $344,545 | $183,758 | $160,787 |
| 2019 | $4,563 | $337,790 | $180,155 | $157,635 |
| 2018 | $4,492 | $331,168 | $176,623 | $154,545 |
| 2017 | $4,393 | $324,675 | $173,160 | $151,515 |
| 2016 | $4,280 | $318,310 | $169,765 | $148,545 |
| 2015 | $3,992 | $313,529 | $167,215 | $146,314 |
| 2014 | $3,930 | $307,388 | $163,940 | $143,448 |
Source: Public Records
Map
Nearby Homes
- 1019 Westview Dr
- 1091 Century Dr
- 1040 Mccormick Ln
- 3391 Ellen Way
- 3344 Linda Mesa Way
- 1040 Round Hill Cir
- 1125 Westview Dr
- 4048 Browns Valley Rd
- 1183 Mountain View Cir
- 3479 Meadowbrook Dr
- 2941 Brookwood Dr
- 115 Waterstone Ct
- 2539 Rollingwood Dr
- 1263 Buhman Ave
- 4155 Casper Way
- 4138 Casper Way
- 100 Waterstone Ct
- 3200 Twin Oaks Dr
- 1015 Borrette Ct
- 1049 Charlson Way
- 1027 Westview Dr
- 1028 Century Dr
- 1024 Century Dr
- 1030 Century Dr
- 1031 Westview Dr
- 3379 Sunview Dr
- 1015 Westview Dr
- 1034 Century Dr
- 1020 Century Dr
- 1020 Westview Dr
- 1035 Westview Dr
- 3378 Sunview Dr
- 3375 Sunview Dr
- 1038 Century Dr
- 1007 Westview Dr
- 3370 Sunview Dr
- 1039 Westview Dr
- 3320 Sunview Dr
- 3367 Sunview Dr
- 1023 Century Dr