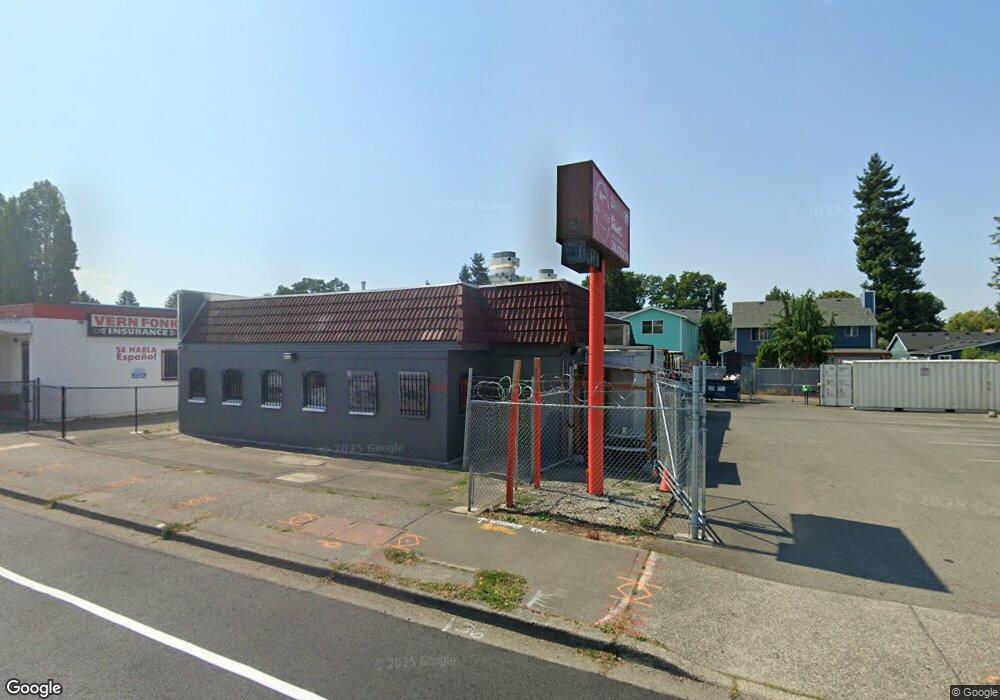
10231 16th Ave SW Seattle, WA 98146
White Center NeighborhoodEstimated Value: $966,778
--
Bed
--
Bath
2,575
Sq Ft
$375/Sq Ft
Est. Value
About This Home
This home is located at 10231 16th Ave SW, Seattle, WA 98146 and is currently estimated at $966,778, approximately $375 per square foot. 10231 16th Ave SW is a home located in King County with nearby schools including Shorewood Elementary School, Cascade Middle School, and Evergreen High School.
Ownership History
Date
Name
Owned For
Owner Type
Purchase Details
Closed on
Mar 6, 2024
Sold by
Monvat Llc
Bought by
King County
Current Estimated Value
Purchase Details
Closed on
Oct 8, 2020
Sold by
Teeceedee Llc
Bought by
Monvat Llc
Purchase Details
Closed on
Aug 28, 2019
Sold by
Manolakos Georgia and Pangopoulos Evgenia
Bought by
Teeceedee Llc
Home Financials for this Owner
Home Financials are based on the most recent Mortgage that was taken out on this home.
Original Mortgage
$628,000
Interest Rate
3.7%
Mortgage Type
Commercial
Purchase Details
Closed on
Oct 13, 2017
Sold by
Manolakos Georgia
Bought by
American Prestige Homes Inc
Home Financials for this Owner
Home Financials are based on the most recent Mortgage that was taken out on this home.
Original Mortgage
$187,200
Interest Rate
3.82%
Purchase Details
Closed on
Dec 27, 1982
Sold by
Friedman Leo and Friedman Esther
Bought by
Nieder Michael Alan
Create a Home Valuation Report for This Property
The Home Valuation Report is an in-depth analysis detailing your home's value as well as a comparison with similar homes in the area
Home Values in the Area
Average Home Value in this Area
Purchase History
| Date | Buyer | Sale Price | Title Company |
|---|---|---|---|
| King County | $313 | None Listed On Document | |
| Monvat Llc | $770,000 | Chicago Title | |
| Teeceedee Llc | $785,000 | Ticor Title | |
| American Prestige Homes Inc | $180,000 | Cw Title | |
| Nieder Michael Alan | -- | -- |
Source: Public Records
Mortgage History
| Date | Status | Borrower | Loan Amount |
|---|---|---|---|
| Previous Owner | Teeceedee Llc | $628,000 | |
| Previous Owner | American Prestige Homes Inc | $187,200 |
Source: Public Records
Tax History Compared to Growth
Tax History
| Year | Tax Paid | Tax Assessment Tax Assessment Total Assessment is a certain percentage of the fair market value that is determined by local assessors to be the total taxable value of land and additions on the property. | Land | Improvement |
|---|---|---|---|---|
| 2024 | $8,991 | $696,200 | $332,500 | $363,700 |
| 2023 | $9,210 | $696,200 | $332,500 | $363,700 |
| 2022 | $8,159 | $620,000 | $285,000 | $335,000 |
| 2021 | $7,411 | $575,700 | $237,500 | $338,200 |
| 2020 | $5,601 | $484,900 | $228,000 | $256,900 |
| 2018 | $5,403 | $325,600 | $209,000 | $116,600 |
| 2017 | $5,309 | $317,300 | $209,000 | $108,300 |
| 2016 | $4,779 | $317,300 | $209,000 | $108,300 |
| 2015 | $5,016 | $303,600 | $209,000 | $94,600 |
| 2014 | -- | $316,600 | $209,000 | $107,600 |
| 2013 | -- | $317,300 | $209,000 | $108,300 |
Source: Public Records
Map
Nearby Homes
- 10232 17th Ave SW
- 10201 17th Ave SW
- 10041 15th Ave SW
- 2117 SW 103rd Place
- 10603 12th Ave SW
- 2211 SW 103rd Place
- 9827 20th Ave SW
- 10436 11th Ave SW
- 2233 SW 104th St
- 10743 14th Ave SW
- 10705 11th Ave SW
- 1803 SW 96th Ln
- 1807 SW 96th Ln
- 9642 13th Ave SW
- 10045 9th Ave SW
- 9834 11th Ave SW
- 10758 22nd Ave SW
- 9714 11th Ave SW
- 11033 18th Ave SW
- 11060 16th Ave SW Unit 1-42
- 10223 16th Ave SW
- 10237 16th Ave SW
- 10259 16th Ave SW
- 10236 17th Ave SW
- 10222 17th Ave SW
- 10238 17th Ave SW
- 10238 16th Ave SW
- 10244 17th Ave SW
- 10216 17th Ave SW Unit C
- 10216 17th Ave SW
- 10246 17th Ave SW
- 10261 16th Ave SW
- 10261 16th Ave SW Unit B
- 10250 17th Ave SW
- 10252 17th Ave SW
- 10231 17th Ave SW
- 10235 17th Ave SW
- 10229 17th Ave SW