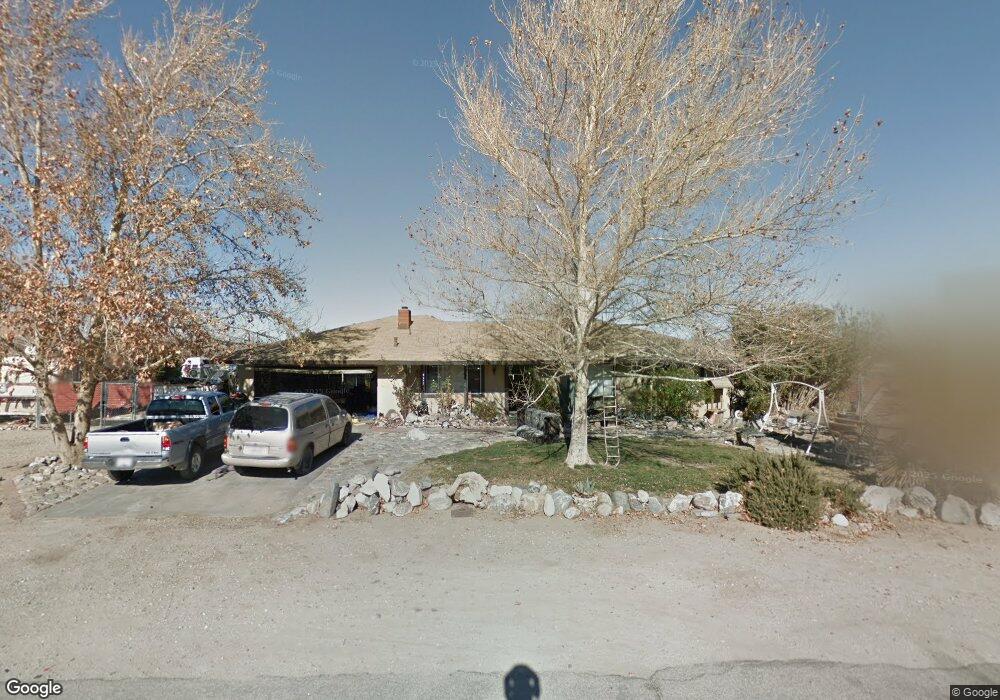
10231 E Avenue r6 Littlerock, CA 93543
Estimated Value: $433,000 - $489,000
3
Beds
2
Baths
1,814
Sq Ft
$253/Sq Ft
Est. Value
About This Home
This home is located at 10231 E Avenue r6, Littlerock, CA 93543 and is currently estimated at $459,445, approximately $253 per square foot. 10231 E Avenue r6 is a home located in Los Angeles County with nearby schools including Daisy Gibson Elementary School, Keppel Academy, and Littlerock High School.
Ownership History
Date
Name
Owned For
Owner Type
Purchase Details
Closed on
Jan 7, 1999
Sold by
Age Cedric
Bought by
Ferguson John C and Ferguson Laura A
Current Estimated Value
Home Financials for this Owner
Home Financials are based on the most recent Mortgage that was taken out on this home.
Original Mortgage
$99,182
Outstanding Balance
$22,945
Interest Rate
6.73%
Mortgage Type
FHA
Estimated Equity
$436,500
Purchase Details
Closed on
Aug 5, 1998
Sold by
Hud
Bought by
Age Cedric
Home Financials for this Owner
Home Financials are based on the most recent Mortgage that was taken out on this home.
Original Mortgage
$55,200
Interest Rate
9.75%
Purchase Details
Closed on
Nov 20, 1997
Sold by
First Financial Bank Fsb
Bought by
Hud
Purchase Details
Closed on
Sep 22, 1997
Sold by
Munekata Edson and Munekata Famita
Bought by
First Financial Bank Fsb
Create a Home Valuation Report for This Property
The Home Valuation Report is an in-depth analysis detailing your home's value as well as a comparison with similar homes in the area
Home Values in the Area
Average Home Value in this Area
Purchase History
| Date | Buyer | Sale Price | Title Company |
|---|---|---|---|
| Ferguson John C | $100,000 | Investors Title Company | |
| Age Cedric | $69,000 | Fidelity Title | |
| Hud | -- | American Title | |
| First Financial Bank Fsb | $92,400 | American Title Co |
Source: Public Records
Mortgage History
| Date | Status | Borrower | Loan Amount |
|---|---|---|---|
| Open | Ferguson John C | $99,182 | |
| Previous Owner | Age Cedric | $55,200 |
Source: Public Records
Tax History
| Year | Tax Paid | Tax Assessment Tax Assessment Total Assessment is a certain percentage of the fair market value that is determined by local assessors to be the total taxable value of land and additions on the property. | Land | Improvement |
|---|---|---|---|---|
| 2025 | $2,201 | $181,319 | $31,340 | $149,979 |
| 2024 | $2,201 | $177,765 | $30,726 | $147,039 |
| 2023 | $2,154 | $174,280 | $30,124 | $144,156 |
| 2022 | $2,115 | $170,864 | $29,534 | $141,330 |
| 2021 | $6,665 | $167,514 | $28,955 | $138,559 |
| 2019 | $6,602 | $162,548 | $28,098 | $134,450 |
| 2018 | $1,984 | $159,362 | $27,548 | $131,814 |
| 2016 | $1,850 | $153,176 | $26,479 | $126,697 |
| 2015 | $1,823 | $150,876 | $26,082 | $124,794 |
| 2014 | $1,820 | $147,922 | $25,572 | $122,350 |
Source: Public Records
Map
Nearby Homes
- 0 Ave R6 Vic 105 Ste
- 10319 E Avenue r8
- 10041 E Avenue r6
- 0 Cor Avenue R8 145th Ste
- 10231 E Avenue r2
- 10306 E Avenue r10
- 9249 E Avenue R 4
- 9249 E East Ave R4
- 1000 100th St E
- 0 E Avenue R 10
- 0 Cor Ave R8 100th Ste Unit 25005146
- 10347 E Avenue R 12
- 0 E Vic Avenue R 84th Ste St
- 0 Ave R4 Drt Vic 108th St Unit 26002042
- 10645 E Avenue r12
- 10120 E Avenue q12
- 10247 East Ave S
- 0 East Ave S
- 10837 E Avenue r10
- 37324 97th St E
- 10243 E Avenue r6
- 10217 E Avenue R 6
- 10217 E Avenue r6
- 10226 E Avenue r6
- 10242 E Avenue r6
- 10218 E Avenue r6
- 10205 E Avenue r6
- 10206 E Avenue r6
- 10258 E Avenue r6
- 10304 E Avenue r6
- 10159 E Avenue r6
- 0 Ave R6 and 105 Ste Unit 21005280
- 10156 E Avenue r6
- 10206 E Avenue r4
- 10256 E Avenue r4
- 10242 E Avenue r4
- 10212 E Avenue r4
- 10320 E Avenue r6
- 10144 E Avenue r6
- 10323 E Avenue r6
Your Personal Tour Guide
Ask me questions while you tour the home.