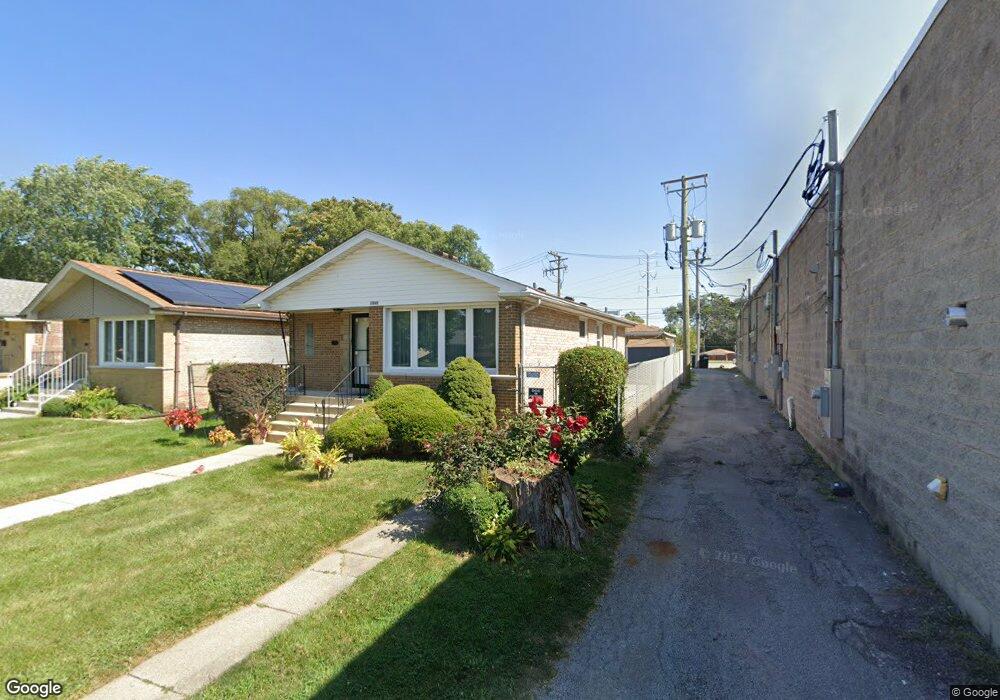
10233 S Beverly Ave Chicago, IL 60643
Washington Heights NeighborhoodEstimated Value: $205,872 - $242,000
3
Beds
1
Bath
1,120
Sq Ft
$197/Sq Ft
Est. Value
About This Home
This home is located at 10233 S Beverly Ave, Chicago, IL 60643 and is currently estimated at $220,718, approximately $197 per square foot. 10233 S Beverly Ave is a home located in Cook County with nearby schools including Garvey M Elementary School, Julian High School, and United Educational Cultural Academy.
Ownership History
Date
Name
Owned For
Owner Type
Purchase Details
Closed on
Jun 30, 2001
Sold by
Ireland Alfred J
Bought by
Ireland Caroline
Current Estimated Value
Purchase Details
Closed on
Jul 7, 1998
Sold by
Ireland Alfred J
Bought by
Ireland Alfred J and Ireland Caroline
Purchase Details
Closed on
Feb 6, 1998
Sold by
Granger Judy
Bought by
Ireland Alfred J
Home Financials for this Owner
Home Financials are based on the most recent Mortgage that was taken out on this home.
Original Mortgage
$84,350
Outstanding Balance
$15,118
Interest Rate
7.14%
Estimated Equity
$205,600
Purchase Details
Closed on
Oct 29, 1997
Sold by
American Housing Trust Iii
Bought by
Granger Judy
Home Financials for this Owner
Home Financials are based on the most recent Mortgage that was taken out on this home.
Original Mortgage
$63,900
Interest Rate
10.49%
Purchase Details
Closed on
Oct 9, 1987
Sold by
Va
Bought by
El Ali M
Create a Home Valuation Report for This Property
The Home Valuation Report is an in-depth analysis detailing your home's value as well as a comparison with similar homes in the area
Home Values in the Area
Average Home Value in this Area
Purchase History
| Date | Buyer | Sale Price | Title Company |
|---|---|---|---|
| Ireland Caroline | -- | -- | |
| Ireland Alfred J | -- | -- | |
| Ireland Alfred J | $87,000 | 1St American Title | |
| Granger Judy | $47,333 | Chicago Title Insurance Co | |
| El Ali M | -- | -- |
Source: Public Records
Mortgage History
| Date | Status | Borrower | Loan Amount |
|---|---|---|---|
| Open | Ireland Alfred J | $84,350 | |
| Previous Owner | Granger Judy | $63,900 |
Source: Public Records
Tax History Compared to Growth
Tax History
| Year | Tax Paid | Tax Assessment Tax Assessment Total Assessment is a certain percentage of the fair market value that is determined by local assessors to be the total taxable value of land and additions on the property. | Land | Improvement |
|---|---|---|---|---|
| 2024 | $2,471 | $15,000 | $5,521 | $9,479 |
| 2023 | $2,389 | $15,000 | $4,359 | $10,641 |
| 2022 | $2,389 | $15,000 | $4,359 | $10,641 |
| 2021 | $2,353 | $15,000 | $4,359 | $10,641 |
| 2020 | $1,188 | $8,422 | $4,359 | $4,063 |
| 2019 | $1,174 | $9,255 | $4,359 | $4,896 |
| 2018 | $1,152 | $9,255 | $4,359 | $4,896 |
| 2017 | $1,930 | $12,320 | $3,777 | $8,543 |
| 2016 | $1,972 | $12,320 | $3,777 | $8,543 |
| 2015 | $1,781 | $12,320 | $3,777 | $8,543 |
| 2014 | $1,575 | $11,036 | $3,487 | $7,549 |
| 2013 | $1,533 | $11,036 | $3,487 | $7,549 |
Source: Public Records
Map
Nearby Homes
- 10152 S Winston Ave
- 10024 S Vincennes Ave
- 10116 S Malta St
- 10134 S Charles St
- 10219 S Racine Ave
- 9976 S Winston Ave
- 9969 S Winston Ave
- 1520 W 103rd St
- 1134 W 104th St
- 10133 S Aberdeen St
- 10103 S Aberdeen St
- 1040 W 103rd St
- 1121 W 104th St
- 1024 W 103rd St
- 1028 W 103rd Place
- 1040 W 104th St
- 1038 W 104th St
- 1103 W 104th Place
- 9834 S Throop St
- 1011 W 103rd Place
- 10229 S Beverly Ave
- 10225 S Beverly Ave
- 10225 S Beverly Ave
- 10221 S Beverly Ave
- 10215 S Beverly Ave
- 10213 S Beverly Ave
- 10211 S Beverly Ave
- 10200 S Vincennes Ave
- 10209 S Beverly Ave
- 10228 S Beverly Ave
- 10234 S Beverly Ave
- 10222 S Beverly Ave
- 10238 S Beverly Ave
- 10218 S Beverly Ave
- 10203 S Beverly Ave
- 10194 S Winston Ave
- 10270 S Beverly Ave
- 10244 S Beverly Ave
- 10212 S Beverly Ave
- 10250 S Beverly Ave