10236 Viterbo St Las Vegas, NV 89183
Silverado Ranch NeighborhoodEstimated Value: $381,221 - $388,000
3
Beds
3
Baths
1,531
Sq Ft
$251/Sq Ft
Est. Value
About This Home
This home is located at 10236 Viterbo St, Las Vegas, NV 89183 and is currently estimated at $383,555, approximately $250 per square foot. 10236 Viterbo St is a home located in Clark County with nearby schools including Shirley A Barber Elementary, Charles Silvestri Junior High School, and Liberty High School.
Ownership History
Date
Name
Owned For
Owner Type
Purchase Details
Closed on
Jun 26, 2019
Sold by
King Futt S Pfm Llc Series Lv Propertes
Bought by
King Futt S Pfm Llc Series 10236 Viterbo
Current Estimated Value
Purchase Details
Closed on
Mar 31, 2009
Sold by
Dalusung Odilon N
Bought by
King Futts Pfm Llc Series Lv Properties
Purchase Details
Closed on
Dec 20, 2004
Sold by
Avada Llc
Bought by
Dalusing Odilon N
Home Financials for this Owner
Home Financials are based on the most recent Mortgage that was taken out on this home.
Original Mortgage
$216,000
Interest Rate
5.62%
Mortgage Type
Unknown
Create a Home Valuation Report for This Property
The Home Valuation Report is an in-depth analysis detailing your home's value as well as a comparison with similar homes in the area
Home Values in the Area
Average Home Value in this Area
Purchase History
| Date | Buyer | Sale Price | Title Company |
|---|---|---|---|
| King Futt S Pfm Llc Series 10236 Viterbo | -- | None Available | |
| King Futts Pfm Llc Series Lv Properties | $91,241 | Cr Title Services Inc | |
| Dalusing Odilon N | $259,990 | First Amer Title Co Of Nv |
Source: Public Records
Mortgage History
| Date | Status | Borrower | Loan Amount |
|---|---|---|---|
| Previous Owner | Dalusing Odilon N | $216,000 |
Source: Public Records
Property History
| Date | Event | Price | List to Sale | Price per Sq Ft |
|---|---|---|---|---|
| 03/06/2025 03/06/25 | Off Market | $1,925 | -- | -- |
| 01/23/2025 01/23/25 | Price Changed | $1,925 | 0.0% | $1 / Sq Ft |
| 01/23/2025 01/23/25 | For Rent | $1,925 | -- | -- |
Tax History Compared to Growth
Tax History
| Year | Tax Paid | Tax Assessment Tax Assessment Total Assessment is a certain percentage of the fair market value that is determined by local assessors to be the total taxable value of land and additions on the property. | Land | Improvement |
|---|---|---|---|---|
| 2025 | $1,685 | $100,718 | $33,950 | $66,768 |
| 2024 | $1,561 | $100,718 | $33,950 | $66,768 |
| 2023 | $1,561 | $88,204 | $25,200 | $63,004 |
| 2022 | $1,445 | $79,498 | $22,050 | $57,448 |
| 2021 | $1,339 | $76,290 | $21,700 | $54,590 |
| 2020 | $1,240 | $75,034 | $21,000 | $54,034 |
| 2019 | $1,162 | $71,282 | $18,200 | $53,082 |
| 2018 | $1,109 | $64,862 | $14,000 | $50,862 |
| 2017 | $1,890 | $64,427 | $12,950 | $51,477 |
| 2016 | $1,039 | $54,785 | $10,150 | $44,635 |
| 2015 | $1,036 | $45,075 | $8,400 | $36,675 |
| 2014 | $1,256 | $33,207 | $5,250 | $27,957 |
Source: Public Records
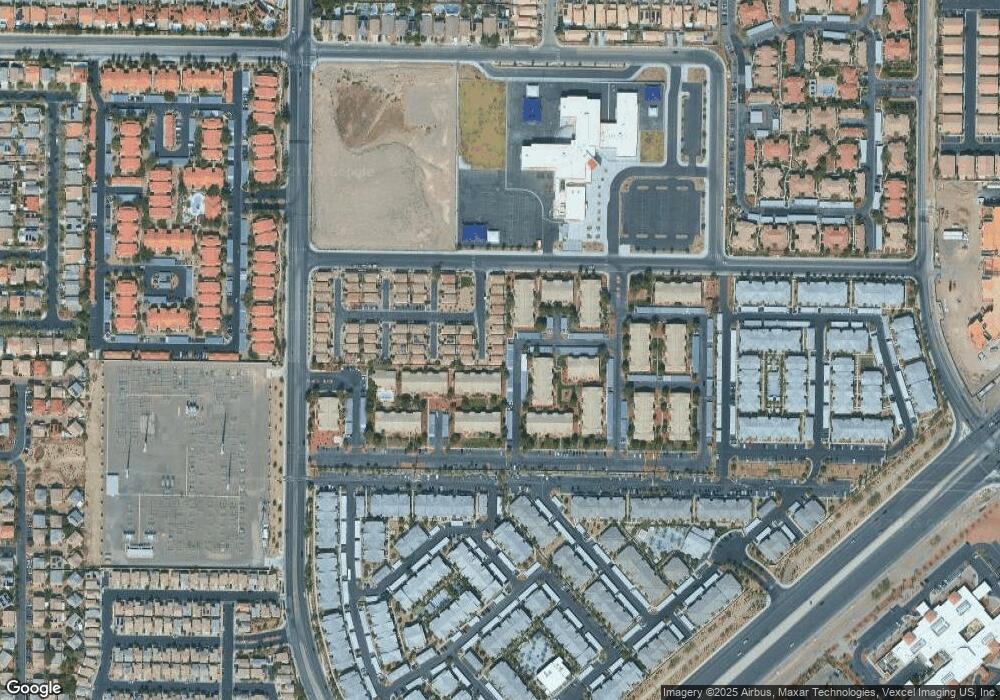
Map
Nearby Homes
- 1675 Tristan Flower Ave
- 1844 Ghost Trace Ave
- 2013 Spiers Ave
- 10034 Candle Maker St
- 1553 Ivygate Ave
- 10263 Cherry Brook St
- 2295 Koho Dr Unit 101
- 2359 Koho Dr Unit 102
- 1538 Tillman Falls Ave
- 10337 Adams Chase St Unit 1
- 10282 Keystone Pastures St
- 9994 Government Point Way Unit 101
- 1511 Balsam Mist Ave
- 1551 Echo Falls Ave
- 1385 Louisiana Lakes Ave
- 1373 Hawaiian Hills Ave
- 1436 Maryland Heights Ave
- 1401 Balsam Mist Ave
- 1582 Juniper Twig Ave
- 1593 Graystone Canyon Ave
- 10230 Viterbo St
- 10242 Viterbo St
- 10224 Viterbo St
- 10237 Viterbo St
- 10243 Viterbo St
- 10231 Viterbo St
- 10218 Viterbo St
- 10218 Viterbo St
- 10218 Viterbo St
- 10218 Viterbo St
- 10218 Viterbo St
- 10218 Viterbo St
- 10225 Viterbo St
- 10214 Viterbo St
- 1889 Versante Ave
- 1893 Versante Ave
- 10210 Viterbo St
- 1885 Versante Ave
- 1897 Versante Ave
- 10206 Viterbo St