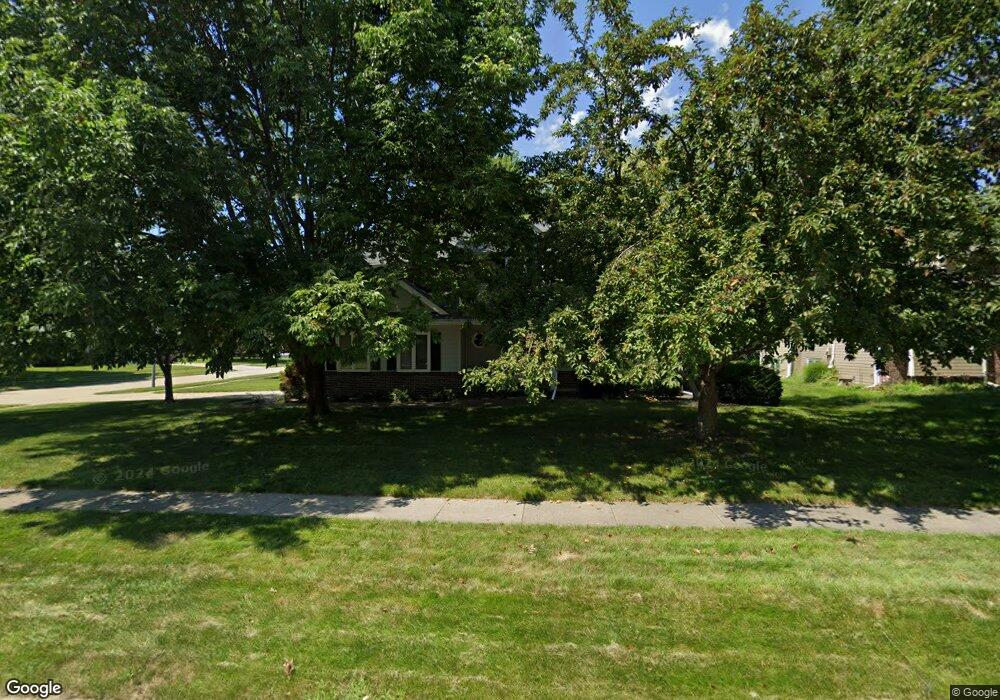
1024 58th St West Des Moines, IA 50266
Estimated Value: $376,000 - $410,000
4
Beds
3
Baths
2,150
Sq Ft
$183/Sq Ft
Est. Value
About This Home
This home is located at 1024 58th St, West Des Moines, IA 50266 and is currently estimated at $392,924, approximately $182 per square foot. 1024 58th St is a home located in Polk County with nearby schools including Westridge Elementary School, Valley Southwoods Freshman High School, and Indian Hills Junior High School.
Ownership History
Date
Name
Owned For
Owner Type
Purchase Details
Closed on
Mar 26, 2025
Sold by
Newton Robert C and Mahon Denise L
Bought by
Newton-Mahon Revocable Trust and Newton
Current Estimated Value
Purchase Details
Closed on
Nov 4, 2020
Sold by
Robert Denise Lyn and Newton Robert C
Bought by
Socirty Des Moines Film
Home Financials for this Owner
Home Financials are based on the most recent Mortgage that was taken out on this home.
Original Mortgage
$331,200
Interest Rate
6%
Mortgage Type
Land Contract Argmt. Of Sale
Purchase Details
Closed on
Feb 25, 1997
Sold by
Schulte Richard M and Schulte Kari J
Bought by
Newton Robert C and Mahon Denise L
Home Financials for this Owner
Home Financials are based on the most recent Mortgage that was taken out on this home.
Original Mortgage
$121,800
Interest Rate
7.73%
Create a Home Valuation Report for This Property
The Home Valuation Report is an in-depth analysis detailing your home's value as well as a comparison with similar homes in the area
Home Values in the Area
Average Home Value in this Area
Purchase History
| Date | Buyer | Sale Price | Title Company |
|---|---|---|---|
| Newton-Mahon Revocable Trust | -- | None Listed On Document | |
| Newton-Mahon Revocable Trust | -- | None Listed On Document | |
| Socirty Des Moines Film | $381,200 | None Available | |
| Newton Robert C | $173,500 | -- |
Source: Public Records
Mortgage History
| Date | Status | Borrower | Loan Amount |
|---|---|---|---|
| Previous Owner | Socirty Des Moines Film | $331,200 | |
| Previous Owner | Newton Robert C | $121,800 |
Source: Public Records
Tax History Compared to Growth
Tax History
| Year | Tax Paid | Tax Assessment Tax Assessment Total Assessment is a certain percentage of the fair market value that is determined by local assessors to be the total taxable value of land and additions on the property. | Land | Improvement |
|---|---|---|---|---|
| 2024 | $5,142 | $341,900 | $69,700 | $272,200 |
| 2023 | $5,404 | $341,900 | $69,700 | $272,200 |
| 2022 | $5,338 | $288,700 | $60,500 | $228,200 |
| 2021 | $5,128 | $288,700 | $60,500 | $228,200 |
| 2020 | $5,046 | $264,300 | $55,400 | $208,900 |
| 2019 | $4,778 | $264,300 | $55,400 | $208,900 |
| 2018 | $4,786 | $241,800 | $49,300 | $192,500 |
| 2017 | $4,466 | $241,800 | $49,300 | $192,500 |
| 2016 | $4,364 | $219,800 | $44,300 | $175,500 |
| 2015 | $4,364 | $219,800 | $44,300 | $175,500 |
| 2014 | $4,178 | $214,900 | $42,300 | $172,600 |
Source: Public Records
Map
Nearby Homes