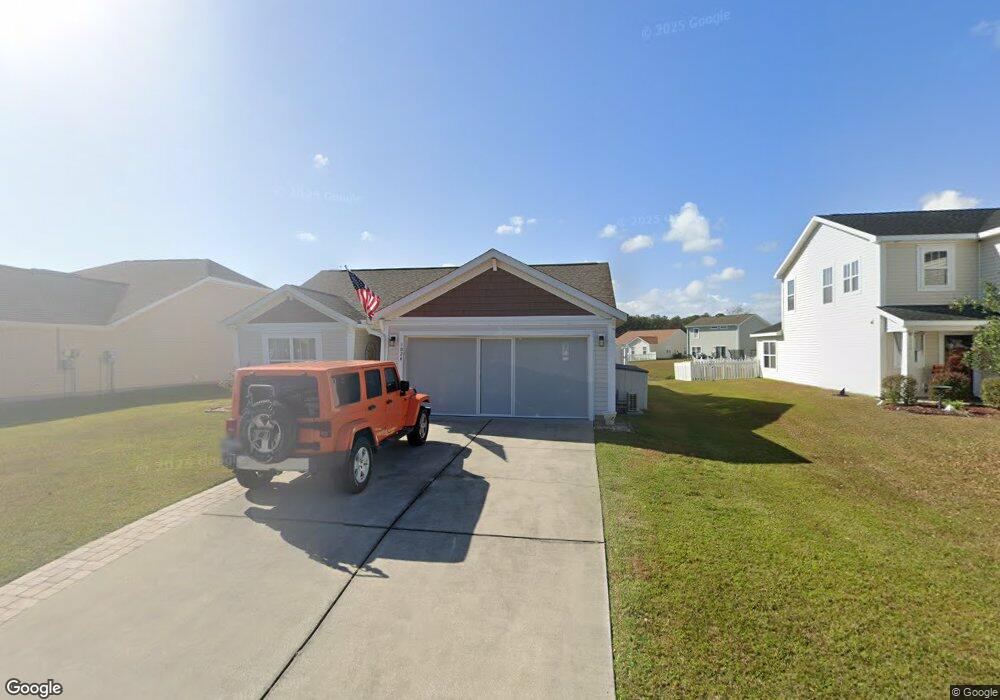
1024 Bonita Loop Unit 1024 Bonita Loop Myrtle Beach, SC 29588
Burgess NeighborhoodEstimated Value: $290,000 - $363,000
3
Beds
2
Baths
1,284
Sq Ft
$246/Sq Ft
Est. Value
About This Home
This home is located at 1024 Bonita Loop Unit 1024 Bonita Loop, Myrtle Beach, SC 29588 and is currently estimated at $315,329, approximately $245 per square foot. 1024 Bonita Loop Unit 1024 Bonita Loop is a home located in Horry County with nearby schools including Burgess Elementary School, St. James Middle School, and St. James Intermediate.
Ownership History
Date
Name
Owned For
Owner Type
Purchase Details
Closed on
Sep 18, 2024
Sold by
Hinkle Harry W
Bought by
Hinkle Harry W and Brown Nancy Louise
Current Estimated Value
Purchase Details
Closed on
Sep 30, 2015
Bought by
Hinkle Harry W
Purchase Details
Closed on
Feb 8, 2011
Sold by
Federal National Mortgage Association
Bought by
Myotte Melissa Kay
Purchase Details
Closed on
Nov 11, 2010
Sold by
Master In Equity Horry County
Bought by
Federal National Mortgage Association
Purchase Details
Closed on
Jul 17, 2007
Sold by
Beazer Homes Corp
Bought by
Boston Joseph and Boston Giovanna
Home Financials for this Owner
Home Financials are based on the most recent Mortgage that was taken out on this home.
Original Mortgage
$142,500
Interest Rate
6.65%
Mortgage Type
Purchase Money Mortgage
Create a Home Valuation Report for This Property
The Home Valuation Report is an in-depth analysis detailing your home's value as well as a comparison with similar homes in the area
Home Values in the Area
Average Home Value in this Area
Purchase History
| Date | Buyer | Sale Price | Title Company |
|---|---|---|---|
| Hinkle Harry W | -- | -- | |
| Hinkle Harry W | $155,000 | -- | |
| Myotte Melissa Kay | -- | -- | |
| Federal National Mortgage Association | $110,000 | -- | |
| Boston Joseph | $178,175 | Attorney |
Source: Public Records
Mortgage History
| Date | Status | Borrower | Loan Amount |
|---|---|---|---|
| Previous Owner | Boston Joseph | $142,500 |
Source: Public Records
Tax History Compared to Growth
Tax History
| Year | Tax Paid | Tax Assessment Tax Assessment Total Assessment is a certain percentage of the fair market value that is determined by local assessors to be the total taxable value of land and additions on the property. | Land | Improvement |
|---|---|---|---|---|
| 2024 | $1,292 | $12,139 | $3,939 | $8,200 |
| 2023 | $769 | $5,946 | $1,808 | $4,138 |
| 2021 | $699 | $7,096 | $1,808 | $5,288 |
| 2020 | $562 | $7,096 | $1,808 | $5,288 |
| 2019 | $562 | $7,096 | $1,808 | $5,288 |
| 2018 | $508 | $5,170 | $1,614 | $3,556 |
| 2017 | $0 | $5,170 | $1,614 | $3,556 |
| 2016 | -- | $5,170 | $1,614 | $3,556 |
| 2015 | $502 | $5,171 | $1,615 | $3,556 |
| 2014 | $465 | $5,171 | $1,615 | $3,556 |
Source: Public Records
Map
Nearby Homes
- CAMERON Plan at Sandpiper Place
- CURTIS Plan at Sandpiper Place
- CALI Plan at Sandpiper Place
- DEVON Plan at Sandpiper Place
- PERRY Plan at Sandpiper Place
- KERRY Plan at Sandpiper Place
- MANNING Plan at Sandpiper Place
- ARIA Plan at Sandpiper Place
- LEWIS Plan at Sandpiper Place
- 1530 Palmina Loop Unit D
- 408 Empyrean Cir Unit lot 01
- 892 Bonita Loop
- 544 Fanciful Way
- 541 Fanciful Way
- 199 Empyrean Cir
- 176 Empyrean Cir
- 170 New Paradise Way
- 315 Kildare Ct
- 6469 Royal Pine Dr
- 6477 Royal Pine Dr
- 1024 Bonita Loop
- 1020 Bonita Loop
- 1028 Bonita Loop Unit Cameron Village
- 1028 Bonita Loop
- 1032 Bonita Loop
- 1205 Eagle Creek Dr Unit Cameron Village
- 1205 Eagle Creek Dr
- 1201 Eagle Creek Dr
- 1219 Eagle Creek Dr
- 1219 Eagle Creek Dr Unit CAMERON VILLAGE
- 1023 Bonita Loop
- 1027 Bonita Loop Unit Cameron Village
- 1027 Bonita Loop
- 1036 Bonita Loop
- 1223 Eagle Creek Dr
- 1031 Bonita Loop
- 1019 Bonita Loop
- 1227 Eagle Creek Dr
- 1227 Eagle Creek Dr Unit Cameron Village
- 1012 Bonita Loop