1024 Capetown Ave Unit 11 Lehigh Acres, FL 33974
Eisenhower NeighborhoodEstimated Value: $303,000 - $486,000
3
Beds
3
Baths
2,332
Sq Ft
$157/Sq Ft
Est. Value
About This Home
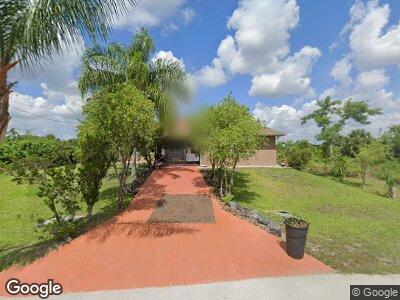
This home is located at 1024 Capetown Ave Unit 11, Lehigh Acres, FL 33974 and is currently estimated at $367,000, approximately $157 per square foot. 1024 Capetown Ave Unit 11 is a home located in Lee County with nearby schools including Lehigh Elementary School, Gateway Elementary School, and The Alva School.
Ownership History
Date
Name
Owned For
Owner Type
Purchase Details
Closed on
Mar 30, 2009
Sold by
The Bank Brevard
Bought by
Panzer Falk and Panzer Agata M
Current Estimated Value
Home Financials for this Owner
Home Financials are based on the most recent Mortgage that was taken out on this home.
Original Mortgage
$81,600
Outstanding Balance
$53,768
Interest Rate
5.1%
Mortgage Type
Unknown
Estimated Equity
$343,630
Purchase Details
Closed on
Jul 12, 2003
Sold by
Natl Recreational Properties Ffl Inc
Bought by
Hing Gerard Lee
Home Financials for this Owner
Home Financials are based on the most recent Mortgage that was taken out on this home.
Original Mortgage
$9,200
Interest Rate
6.07%
Purchase Details
Closed on
Apr 22, 2003
Sold by
Sun Trust Banks Inc
Bought by
Natl Recreational Prop Fl Inc
Create a Home Valuation Report for This Property
The Home Valuation Report is an in-depth analysis detailing your home's value as well as a comparison with similar homes in the area
Home Values in the Area
Average Home Value in this Area
Purchase History
| Date | Buyer | Sale Price | Title Company |
|---|---|---|---|
| Panzer Falk | $80,000 | State Title | |
| Hing Gerard Lee | $9,900 | -- | |
| Hing Gerard | $9,900 | None Available | |
| Natl Recreational Prop Fl Inc | $5,000 | -- |
Source: Public Records
Mortgage History
| Date | Status | Borrower | Loan Amount |
|---|---|---|---|
| Open | Panzer Falk | $81,600 | |
| Previous Owner | Hing Gerard M Lee | $256,500 | |
| Previous Owner | Hing Gerard Lee | $9,200 |
Source: Public Records
Tax History Compared to Growth
Tax History
| Year | Tax Paid | Tax Assessment Tax Assessment Total Assessment is a certain percentage of the fair market value that is determined by local assessors to be the total taxable value of land and additions on the property. | Land | Improvement |
|---|---|---|---|---|
| 2024 | $1,837 | $138,189 | -- | -- |
| 2023 | $1,985 | $134,164 | $0 | $0 |
| 2022 | $1,837 | $130,256 | $0 | $0 |
| 2021 | $1,752 | $211,056 | $4,250 | $206,806 |
| 2020 | $1,748 | $124,716 | $0 | $0 |
| 2019 | $1,713 | $121,912 | $0 | $0 |
| 2018 | $1,683 | $119,639 | $0 | $0 |
| 2017 | $1,630 | $116,072 | $0 | $0 |
| 2016 | $1,595 | $143,775 | $4,000 | $139,775 |
| 2015 | $1,587 | $122,494 | $2,900 | $119,594 |
| 2014 | $1,624 | $111,999 | $2,585 | $109,414 |
| 2013 | -- | $91,796 | $2,200 | $89,596 |
Source: Public Records
Map
Nearby Homes
- 1022 Capetown Ave
- 1026 Capetown Ave
- 1028 Capetown Ave
- 1028 Capetown Ave
- 1030 Capetown Ave
- 941 Capetown Ave
- 1040 Countess Ave
- 1016 Arbordale St
- 1046 Eisenhower Blvd
- 1050 Eisenhower Blvd
- 1015 Countess Ave
- 1024 Brenton Ave
- 1144 Graystone Ave
- 1027 Albion St
- 1029 Albion St
- 1085 Eisenhower Blvd
- 1021 Eubanks St
- 1043 Brenton Ave
- 1035 Albion St
- 948 Kyle Ave
- 1024 Capetown Ave Unit 11
- 1022 Capetown Ave Unit 23
- 1055 Countess Ave
- 1043 Countess Ave
- 1024 Berwick St
- 1040 Berwick St
- 1019 Berwick St
- 1063 Countess Ave
- 1031 Capetown Ave Unit 43
- 1046 Countess Ave
- 1021 Berwick St
- 1019 Alcan St
- 1035 Countess Ave
- 1062 Countess Ave
- 924-926 Countess Ave Unit 926
- 924-926 Countess Ave Unit 924
- 1050 Countess Ave
- 924-926 Countess Ave
- 916-918 Countess Ave
- 1021 Alcan St