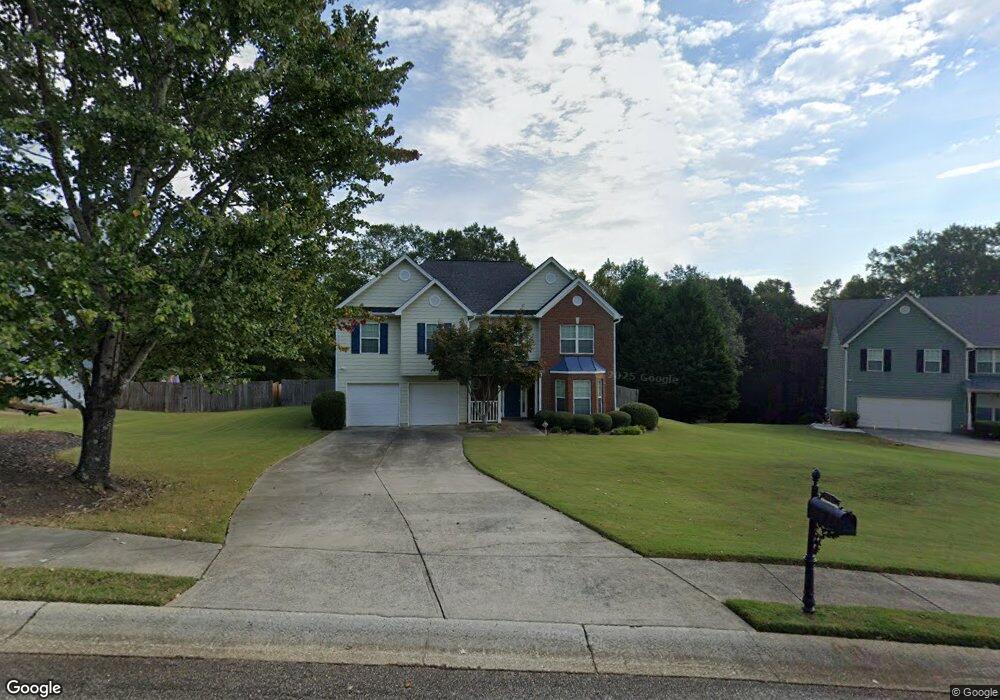
1024 Cyperts Trail Winder, GA 30680
Estimated Value: $370,476 - $420,000
4
Beds
3
Baths
2,556
Sq Ft
$156/Sq Ft
Est. Value
About This Home
This home is located at 1024 Cyperts Trail, Winder, GA 30680 and is currently estimated at $399,619, approximately $156 per square foot. 1024 Cyperts Trail is a home located in Barrow County with nearby schools including Bramlett Elementary School, Russell Middle School, and Winder-Barrow High School.
Ownership History
Date
Name
Owned For
Owner Type
Purchase Details
Closed on
Aug 16, 2007
Sold by
Gfeller Bill and Gfeller Deidre
Bought by
Stern Ilisa B
Current Estimated Value
Home Financials for this Owner
Home Financials are based on the most recent Mortgage that was taken out on this home.
Original Mortgage
$178,000
Outstanding Balance
$110,905
Interest Rate
6.62%
Mortgage Type
New Conventional
Estimated Equity
$288,714
Purchase Details
Closed on
Jul 13, 2005
Sold by
Elmo Fortenberry Builder Inc
Bought by
Gfeller Deidre and Gfeller Bill
Home Financials for this Owner
Home Financials are based on the most recent Mortgage that was taken out on this home.
Original Mortgage
$146,949
Interest Rate
6.19%
Mortgage Type
New Conventional
Purchase Details
Closed on
Mar 11, 2004
Sold by
Hkb Inc
Bought by
Elmo Fortenberry Builder Inc
Purchase Details
Closed on
Aug 15, 2001
Bought by
Hkb Inc
Create a Home Valuation Report for This Property
The Home Valuation Report is an in-depth analysis detailing your home's value as well as a comparison with similar homes in the area
Home Values in the Area
Average Home Value in this Area
Purchase History
| Date | Buyer | Sale Price | Title Company |
|---|---|---|---|
| Stern Ilisa B | $178,000 | -- | |
| Gfeller Deidre | $183,700 | -- | |
| Elmo Fortenberry Builder Inc | $38,500 | -- | |
| Hkb Inc | -- | -- |
Source: Public Records
Mortgage History
| Date | Status | Borrower | Loan Amount |
|---|---|---|---|
| Open | Stern Ilisa B | $178,000 | |
| Previous Owner | Gfeller Deidre | $146,949 |
Source: Public Records
Tax History
| Year | Tax Paid | Tax Assessment Tax Assessment Total Assessment is a certain percentage of the fair market value that is determined by local assessors to be the total taxable value of land and additions on the property. | Land | Improvement |
|---|---|---|---|---|
| 2025 | $2,859 | $122,550 | $28,000 | $94,550 |
| 2024 | $2,961 | $119,693 | $28,000 | $91,693 |
| 2023 | $2,554 | $120,093 | $28,000 | $92,093 |
| 2022 | $3,186 | $112,054 | $26,000 | $86,054 |
| 2021 | $2,652 | $88,123 | $19,200 | $68,923 |
| 2020 | $2,534 | $84,123 | $15,200 | $68,923 |
| 2019 | $2,491 | $81,268 | $15,200 | $66,068 |
| 2018 | $2,214 | $73,023 | $15,200 | $57,823 |
| 2017 | $1,967 | $67,564 | $17,000 | $50,564 |
| 2016 | $1,879 | $63,296 | $17,000 | $46,296 |
| 2015 | $1,903 | $63,806 | $17,000 | $46,806 |
| 2014 | $1,697 | $56,136 | $8,820 | $47,316 |
| 2013 | -- | $53,119 | $8,820 | $44,299 |
Source: Public Records
Map
Nearby Homes
- 24 Rocking Wood Dr
- 21 Rocky Ridge Way
- 156 Rocky Ridge Way
- 177 Deer Canyon Dr
- 153 Deer Canyon Dr
- 93 Rocky Ridge Way
- 127 Deer Canyon Dr
- 687 Ansley Ct
- 23 Deer Canyon Dr
- 1136 Lexington Ridge Rd
- 1009 Easy St
- 840 Champagne Ln
- 866 Champagne Ln
- 857 Champagne Ln
- 568 Versailles Dr
- 103 Treemont Way
- 1381 Larose Dr
- 1224 Treemont Trace
- 1197 Dee Kennedy Rd
- 0 Dee Kennedy Rd Unit 7705088
- 1022 Cyperts Trail Unit 1
- 1026 Cyperts Trail Unit Lot 48
- 1026 Cyperts Trail
- 1023 Cyperts Trail
- 1021 Cyperts Trail Unit Lot 51
- 1020 Cyperts Trail
- 1027 Cyperts Trail
- 1019 Cyperts Trail Unit Lot 52
- 1019 Cyperts Trail
- 1019 Cyperts Trail Unit 1
- 1018 Cyperts Trail
- 1047 Denali Way
- 1043 Denali Way
- 1017 Cyperts Trail Unit Lot 53
- 1017 Cyperts Trail
- 1049 Denali Way
- 1039 Denali Way
- 1037 Denali Way
- 1014 Cyperts Trail
Your Personal Tour Guide
Ask me questions while you tour the home.