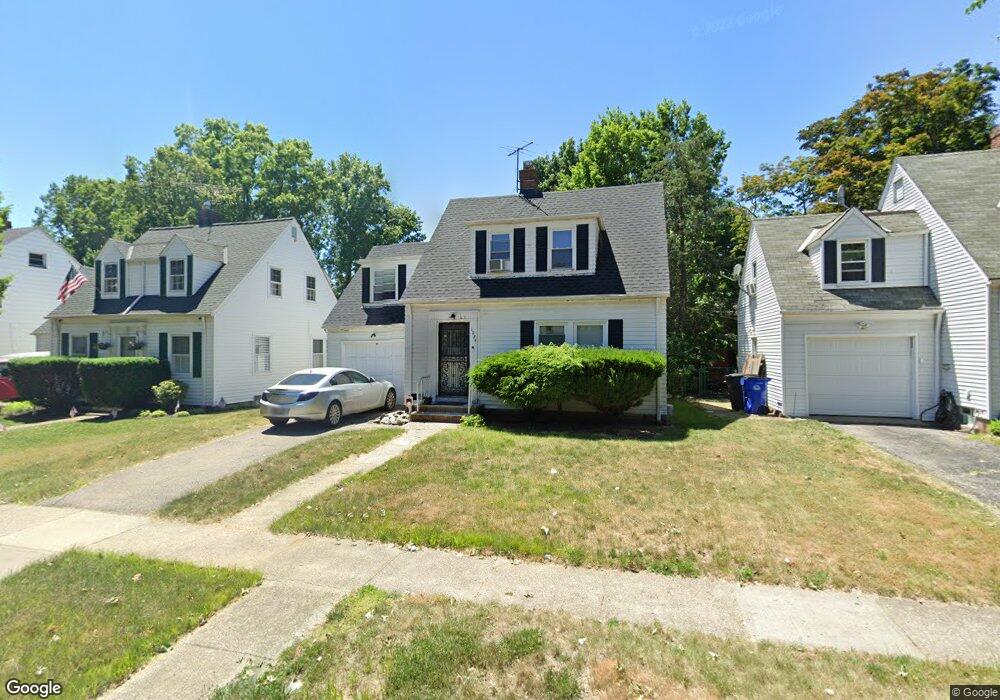
1024 E 176th St Cleveland, OH 44119
North Collinwood NeighborhoodEstimated Value: $102,743 - $133,000
3
Beds
2
Baths
1,272
Sq Ft
$91/Sq Ft
Est. Value
About This Home
This home is located at 1024 E 176th St, Cleveland, OH 44119 and is currently estimated at $115,936, approximately $91 per square foot. 1024 E 176th St is a home located in Cuyahoga County with nearby schools including Lakeshore Intergenerational School, Imagine Bella Academy of Excellence, and Noble Academy-Cleveland.
Ownership History
Date
Name
Owned For
Owner Type
Purchase Details
Closed on
Feb 1, 2013
Sold by
Baker Tracey Lynn and Martin Langston R
Bought by
Shaw William M
Current Estimated Value
Home Financials for this Owner
Home Financials are based on the most recent Mortgage that was taken out on this home.
Original Mortgage
$37,311
Outstanding Balance
$25,944
Interest Rate
3.75%
Mortgage Type
FHA
Estimated Equity
$89,992
Purchase Details
Closed on
May 14, 2001
Sold by
Tobias Barbara J Lawrence
Bought by
Baker Tracey Lynn
Home Financials for this Owner
Home Financials are based on the most recent Mortgage that was taken out on this home.
Original Mortgage
$91,300
Interest Rate
6.99%
Purchase Details
Closed on
Oct 5, 1998
Sold by
Walter Tobias
Bought by
Tobias Barbara J Lawrence
Purchase Details
Closed on
Jul 28, 1988
Sold by
Campbell Theresa M
Bought by
Lawrence Barbara J
Purchase Details
Closed on
Jan 1, 1975
Bought by
Campbell Theresa M
Create a Home Valuation Report for This Property
The Home Valuation Report is an in-depth analysis detailing your home's value as well as a comparison with similar homes in the area
Home Values in the Area
Average Home Value in this Area
Purchase History
We collect this data history from publicly available records. To have your information removed, we recommend requesting removal directly through your county’s website.
| Date | Buyer | Sale Price | Title Company |
|---|---|---|---|
| Shaw William M | $38,000 | Ohio Real Title | |
| Baker Tracey Lynn | $93,900 | -- | |
| Tobias Barbara J Lawrence | -- | -- | |
| Lawrence Barbara J | $49,900 | -- | |
| Campbell Theresa M | -- | -- |
Source: Public Records
Mortgage History
We collect this data history from publicly available records. To have your information removed, we recommend requesting removal directly through your county’s website.
| Date | Status | Borrower | Loan Amount |
|---|---|---|---|
| Open | Shaw William M | $37,311 | |
| Previous Owner | Baker Tracey Lynn | $91,300 |
Source: Public Records
Tax History
| Year | Tax Paid | Tax Assessment Tax Assessment Total Assessment is a certain percentage of the fair market value that is determined by local assessors to be the total taxable value of land and additions on the property. | Land | Improvement |
|---|---|---|---|---|
| 2025 | $2,011 | $30,660 | $4,655 | $26,005 |
| 2024 | $2,011 | $30,660 | $4,655 | $26,005 |
| 2023 | $1,546 | $20,380 | $3,260 | $17,120 |
| 2022 | $1,537 | $20,370 | $3,260 | $17,120 |
| 2021 | $1,521 | $20,370 | $3,260 | $17,120 |
| 2020 | $1,545 | $17,890 | $2,870 | $15,020 |
| 2019 | $1,429 | $51,100 | $8,200 | $42,900 |
| 2018 | $1,424 | $17,890 | $2,870 | $15,020 |
| 2017 | $1,671 | $20,270 | $2,730 | $17,540 |
| 2016 | $1,659 | $20,270 | $2,730 | $17,540 |
| 2015 | $1,912 | $20,270 | $2,730 | $17,540 |
| 2014 | $1,912 | $23,280 | $3,150 | $20,130 |
Source: Public Records
Map
Nearby Homes
- 1051 E 171st St
- 1075 E 177th St
- 1113 E 177th St
- 983 E 179th St
- 1018 E 169th St
- 1109 E 169th St
- 17583 Wildwood Ln Unit 17583
- 1166 E 176th St
- 1074 E 168th St
- 841 Hoover Ave
- 16918 Grovewood Ave
- 18315 Marcella Rd
- 17904 Neff Rd
- 832 Hoover Rd
- 1222 E 172nd St
- 18232 Neff Rd
- 17506 Neff Rd
- 827 Sable Rd
- 17812 E Park Dr
- 1257 E 170th St
- 1020 E 176th St
- 1028 E 176th St
- 1032 E 176th St
- 17512 Nottingham Rd
- 1042 E 176th St
- 1027 E 176th St
- 1021 E 174th St
- 1025 E 174th St
- 17410 Nottingham Rd
- 1029 E 174th St
- 1046 E 176th St
- 1031 E 176th St
- 17406 Nottingham Rd
- 1048 E 176th St
- 1041 E 174th St
- 1043 E 176th St
- 1054 E 176th St
- 1047 E 174th St
- 17628 Nottingham Rd
- 1049 E 176th St
Your Personal Tour Guide
Ask me questions while you tour the home.