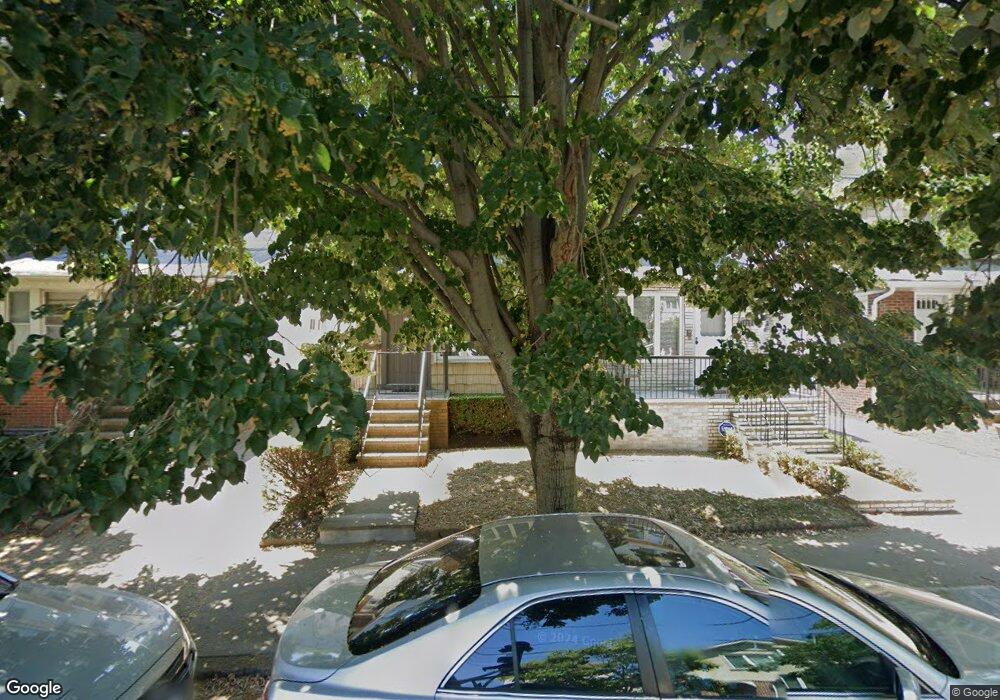
1024 E 27th St Brooklyn, NY 11210
Midwood NeighborhoodEstimated Value: $956,000 - $1,127,777
3
Beds
3
Baths
1,472
Sq Ft
$711/Sq Ft
Est. Value
About This Home
This home is located at 1024 E 27th St, Brooklyn, NY 11210 and is currently estimated at $1,045,944, approximately $710 per square foot. 1024 E 27th St is a home located in Kings County with nearby schools including P.S. 193 Gil Hodges, Andries Hudde School, and Urban Dove Team Charter School.
Ownership History
Date
Name
Owned For
Owner Type
Purchase Details
Closed on
Nov 3, 2016
Sold by
Berg Hadassah and Pessin Mordecai J
Bought by
Berg Hadassah
Current Estimated Value
Home Financials for this Owner
Home Financials are based on the most recent Mortgage that was taken out on this home.
Original Mortgage
$6,058
Interest Rate
3.46%
Mortgage Type
Unknown
Purchase Details
Closed on
Sep 27, 2016
Sold by
Berg Hadassah
Bought by
Berg Hadassah and Pessin Mordecai J
Home Financials for this Owner
Home Financials are based on the most recent Mortgage that was taken out on this home.
Original Mortgage
$6,058
Interest Rate
3.46%
Mortgage Type
Unknown
Purchase Details
Closed on
May 5, 2010
Sold by
Berg Hadassah and Berg Joseph
Bought by
Berg Hadassah
Purchase Details
Closed on
Nov 3, 1999
Sold by
Katz Mark and Katz Naomi
Bought by
Berg Joseph and Berg Hadassah
Home Financials for this Owner
Home Financials are based on the most recent Mortgage that was taken out on this home.
Original Mortgage
$155,000
Interest Rate
7.83%
Create a Home Valuation Report for This Property
The Home Valuation Report is an in-depth analysis detailing your home's value as well as a comparison with similar homes in the area
Home Values in the Area
Average Home Value in this Area
Purchase History
We collect this data history from publicly available records. To have your information removed, we recommend requesting removal directly through your county’s website.
| Date | Buyer | Sale Price | Title Company |
|---|---|---|---|
| Berg Hadassah | -- | -- | |
| Berg Hadassah | -- | -- | |
| Berg Hadassah | -- | -- | |
| Berg Joseph | $270,000 | Washington Title Insurance C |
Source: Public Records
Mortgage History
We collect this data history from publicly available records. To have your information removed, we recommend requesting removal directly through your county’s website.
| Date | Status | Borrower | Loan Amount |
|---|---|---|---|
| Previous Owner | Berg Hadassah | $6,058 | |
| Previous Owner | Berg Joseph | $155,000 |
Source: Public Records
Tax History
| Year | Tax Paid | Tax Assessment Tax Assessment Total Assessment is a certain percentage of the fair market value that is determined by local assessors to be the total taxable value of land and additions on the property. | Land | Improvement |
|---|---|---|---|---|
| 2026 | $8,675 | $71,640 | $19,200 | $52,440 |
| 2025 | $8,181 | $63,060 | $19,200 | $43,860 |
| 2024 | $8,181 | $62,760 | $19,200 | $43,560 |
| 2023 | $7,836 | $61,380 | $19,200 | $42,180 |
| 2022 | $7,266 | $53,940 | $19,200 | $34,740 |
| 2021 | $7,667 | $57,240 | $19,200 | $38,040 |
| 2020 | $3,741 | $50,220 | $19,200 | $31,020 |
| 2019 | $6,738 | $50,220 | $19,200 | $31,020 |
| 2018 | $6,189 | $33,321 | $13,115 | $20,206 |
| 2017 | $5,822 | $31,530 | $11,261 | $20,269 |
| 2016 | $5,693 | $31,530 | $12,820 | $18,710 |
| 2015 | $3,383 | $30,978 | $18,863 | $12,115 |
| 2014 | $3,383 | $29,260 | $16,179 | $13,081 |
Source: Public Records
Map
Nearby Homes
- 2415 Avenue J
- 3199 Bedford Ave
- 3098 Bedford Ave
- 1040 E 24th St
- 928 E 26th St
- 2318 Avenue K
- 1006 E 31st St
- 909 E 29th St Unit 2E
- 909 E 29th St Unit 3D
- 881 E 23rd St
- 1176 E 29th St
- 1179 E 29th St
- 973 E 32nd St
- 961 E 32nd St
- 2525 Nostrand Ave Unit 6T
- 2525 Nostrand Ave Unit 5
- 2525 Nostrand Ave Unit 7E
- 945 E 32nd St
- 850 E 23rd St Unit private house
- 1401 Ocean Ave Unit 12B
Your Personal Tour Guide
Ask me questions while you tour the home.