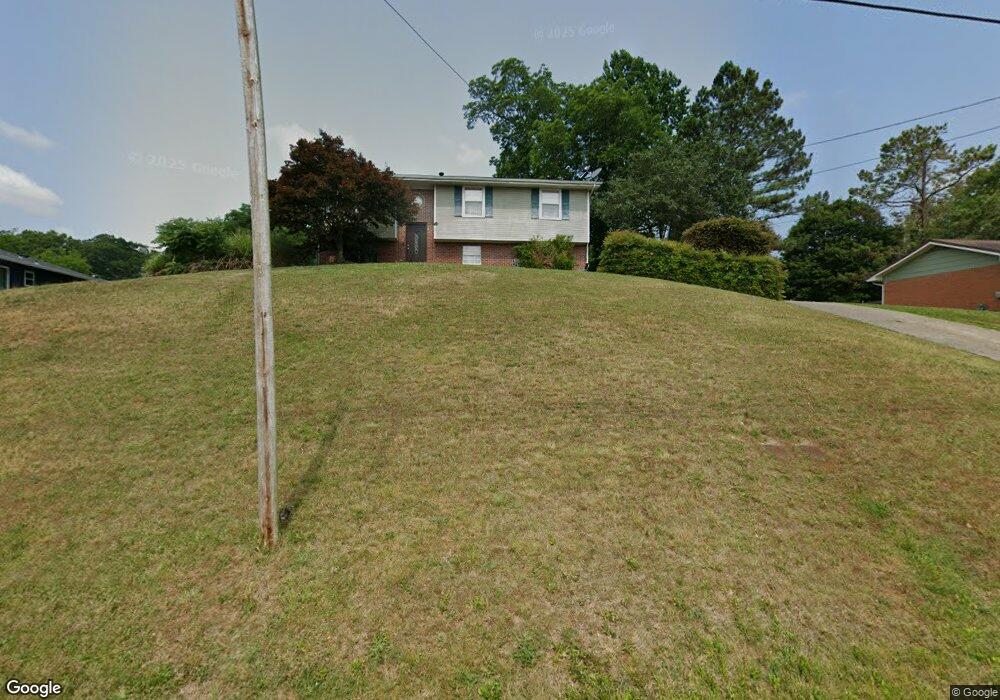
1024 Osburn Rd Chickamauga, GA 30707
Estimated Value: $234,000 - $268,000
3
Beds
2
Baths
1,617
Sq Ft
$152/Sq Ft
Est. Value
About This Home
This home is located at 1024 Osburn Rd, Chickamauga, GA 30707 and is currently estimated at $246,338, approximately $152 per square foot. 1024 Osburn Rd is a home located in Walker County with nearby schools including Cherokee Ridge Elementary School, Rossville Middle School, and Ridgeland High School.
Ownership History
Date
Name
Owned For
Owner Type
Purchase Details
Closed on
Feb 28, 2008
Sold by
Moffitt Mandi L
Bought by
Fitzpatrick James C and Fitzpatrick Rose Stephanie M
Current Estimated Value
Purchase Details
Closed on
Sep 4, 1996
Sold by
Ashley Benjamin and Ashley Rhonda L
Bought by
King Mandi
Purchase Details
Closed on
Nov 30, 1992
Sold by
Boyle Clarence T and Boyle Leissa A
Bought by
Ashley Benjamin and Ashley Rhonda L
Purchase Details
Closed on
Jun 22, 1992
Sold by
Murdock Keith
Bought by
Boyle Clarence T and Boyle Leissa A
Purchase Details
Closed on
Feb 5, 1992
Sold by
Walden Massengale S and Walden C
Bought by
Baker & Summers Const Co Inc
Purchase Details
Closed on
Sep 1, 1986
Sold by
Tapp Teresa G
Bought by
Walden Massengale S and Walden C
Purchase Details
Closed on
Feb 14, 1986
Bought by
Tapp Teresa G
Create a Home Valuation Report for This Property
The Home Valuation Report is an in-depth analysis detailing your home's value as well as a comparison with similar homes in the area
Home Values in the Area
Average Home Value in this Area
Purchase History
| Date | Buyer | Sale Price | Title Company |
|---|---|---|---|
| Fitzpatrick James C | $113,500 | -- | |
| King Mandi | $63,900 | -- | |
| Ashley Benjamin | $58,000 | -- | |
| Boyle Clarence T | $4,000 | -- | |
| Murdock Keith | $2,500 | -- | |
| Baker & Summers Const Co Inc | $2,500 | -- | |
| Walden Massengale S | $2,500 | -- | |
| Tapp Teresa G | $1,200 | -- |
Source: Public Records
Tax History Compared to Growth
Tax History
| Year | Tax Paid | Tax Assessment Tax Assessment Total Assessment is a certain percentage of the fair market value that is determined by local assessors to be the total taxable value of land and additions on the property. | Land | Improvement |
|---|---|---|---|---|
| 2024 | $1,810 | $83,694 | $10,000 | $73,694 |
| 2023 | $1,761 | $79,732 | $10,000 | $69,732 |
| 2022 | $1,669 | $69,186 | $10,000 | $59,186 |
| 2021 | $1,334 | $49,686 | $10,000 | $39,686 |
| 2020 | $1,200 | $42,928 | $10,000 | $32,928 |
| 2019 | $1,221 | $42,928 | $10,000 | $32,928 |
| 2018 | $1,136 | $42,928 | $10,000 | $32,928 |
| 2017 | $1,340 | $42,928 | $10,000 | $32,928 |
| 2016 | $1,131 | $42,928 | $10,000 | $32,928 |
| 2015 | $1,008 | $35,725 | $5,500 | $30,225 |
| 2014 | $916 | $35,725 | $5,500 | $30,225 |
| 2013 | -- | $35,725 | $5,500 | $30,225 |
Source: Public Records
Map
Nearby Homes
- 234 Wilder Rd
- Southport Plan at Cambridge Cove
- Aria Plan at Cambridge Cove
- Bayshore Plan at Cambridge Cove
- 100 Arlington Dr
- 94 Arlington Dr
- 84 Arlington Dr
- 80 Arlington Dr
- 374 Wildewood Trail
- 801 Thomas Ave
- 138 Dana Ln
- 70 Brogdon Dr
- 309 Longwood St
- 74 Lail Rd
- 544 Lail Rd
- 8 W 8th St
- 0 Pearl Ave Unit 1523358
- 1208 Johnson Rd
- 191 Haleys Cove Dr
- 130 Krystal Dr
- 1004 Osburn Rd Unit 1
- 1004 Osburn Rd
- 16 Chandler Rd
- 127 Forrest Park Dr
- 40 Chandler Rd
- 0 Chandler Rd
- 0 Chandler Rd Unit 1138642
- 984 Osburn Rd
- 115 Forrest Park Dr
- 141 Forrest Park Dr
- 60 Chandler Rd
- 966 Osburn Rd
- 80 Chandler Rd
- 1077 Osburn Rd
- 155 Forrest Park Dr
- 95 Forrest Park Dr
- 98 Forrest Park Dr
- 942 Osburn Rd
- 100 Chandler Rd
- 89 Chandler Rd