
Seller's Agent in 2019
Laura Batson
Hops & Homes
(970) 488-0262
29 Total Sales
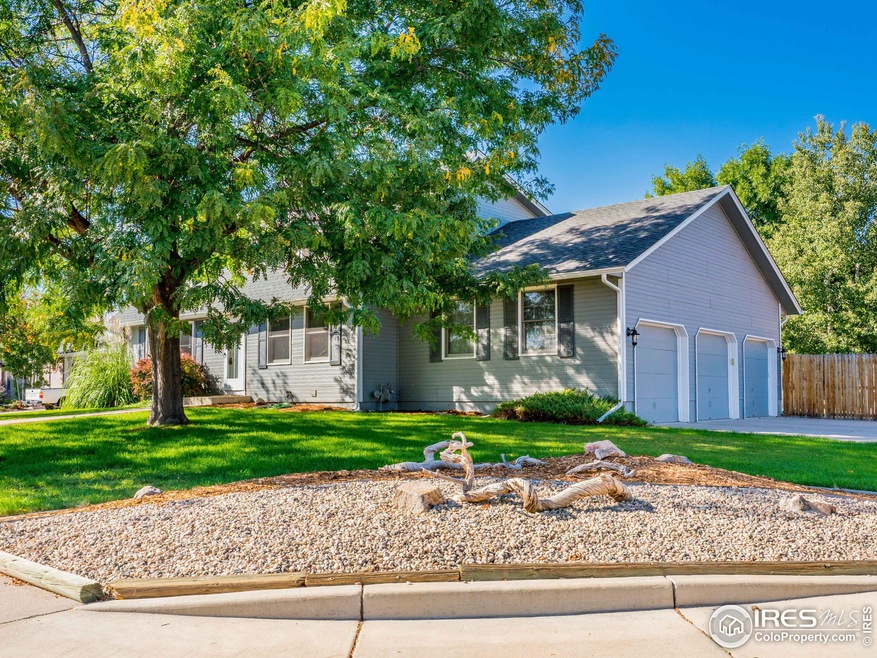
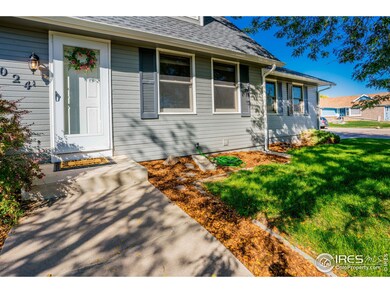
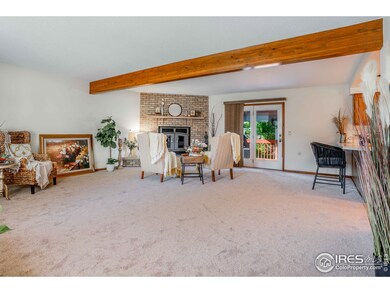
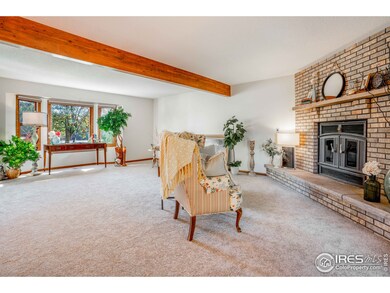
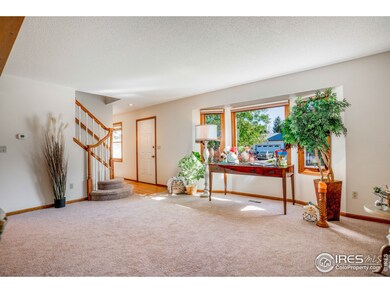

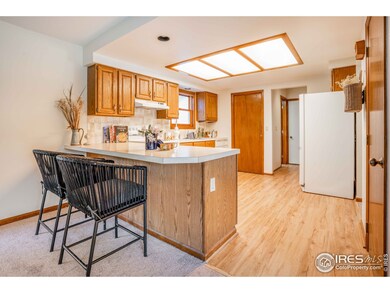
This lovely two-story home is located on a nice, quiet cul-de-sac and features four bedrooms, four baths, and a large well manicured lawn which is fully fenced and has a spacious covered deck! Cozy up next to your fireplace during blustery winter nights or cool off with A/C during the heat waves! There's a finished basement with extra flex space, a three-car garage, space to park your R/V or boat ...and NO HOA! With new flooring on all levels + add'l recent upgrades - this home is move-in-ready!
| Date | Type | Sale Price | Title Company |
|---|---|---|---|
| Interfamily Deed Transfer | -- | None Available | |
| Warranty Deed | $380,000 | First American Title | |
| Warranty Deed | $307,000 | Tggt | |
| Interfamily Deed Transfer | -- | -- | |
| Interfamily Deed Transfer | -- | -- | |
| Interfamily Deed Transfer | -- | -- | |
| Interfamily Deed Transfer | -- | -- | |
| Interfamily Deed Transfer | -- | -- | |
| Interfamily Deed Transfer | -- | -- | |
| Warranty Deed | $142,000 | -- | |
| Deed | $14,500 | -- | |
| Deed | -- | -- |
| Date | Status | Loan Amount | Loan Type |
|---|---|---|---|
| Open | $318,000 | New Conventional | |
| Previous Owner | $150,000 | New Conventional | |
| Previous Owner | $100,000 | No Value Available |
| Date | Event | Price | Change | Sq Ft Price |
|---|---|---|---|---|
| 03/03/2020 03/03/20 | Off Market | $380,000 | -- | -- |
| 11/25/2019 11/25/19 | Sold | $380,000 | -2.3% | $149 / Sq Ft |
| 09/20/2019 09/20/19 | For Sale | $389,000 | +26.7% | $153 / Sq Ft |
| 01/28/2019 01/28/19 | Off Market | $307,000 | -- | -- |
| 06/17/2015 06/17/15 | Sold | $307,000 | -1.0% | $121 / Sq Ft |
| 05/29/2015 05/29/15 | For Sale | $310,000 | -- | $122 / Sq Ft |
| Year | Tax Paid | Tax Assessment Tax Assessment Total Assessment is a certain percentage of the fair market value that is determined by local assessors to be the total taxable value of land and additions on the property. | Land | Improvement |
|---|---|---|---|---|
| 2025 | $2,765 | $30,650 | $5,630 | $25,020 |
| 2024 | $2,765 | $30,650 | $5,630 | $25,020 |
| 2023 | $2,538 | $32,980 | $4,460 | $28,520 |
| 2022 | $2,340 | $24,110 | $4,520 | $19,590 |
| 2021 | $2,180 | $24,800 | $4,650 | $20,150 |
| 2020 | $2,173 | $25,200 | $4,290 | $20,910 |
| 2019 | $2,154 | $25,200 | $4,290 | $20,910 |
| 2018 | $1,894 | $20,970 | $2,520 | $18,450 |
| 2017 | $2,005 | $20,970 | $2,520 | $18,450 |
| 2016 | $1,816 | $19,190 | $2,390 | $16,800 |
| 2015 | $1,602 | $18,200 | $2,390 | $15,810 |
| 2014 | $1,306 | $13,910 | $2,150 | $11,760 |
Seller's Agent in 2019
Laura Batson
Hops & Homes
(970) 488-0262
29 Total Sales
Seller Co-Listing Agent in 2019
Kristie Dehn
Hops & Homes
(970) 980-1668
59 Total Sales
Buyer's Agent in 2019
Jason Mahoney
C3 Real Estate Solutions, LLC
(970) 667-2509
62 Total Sales
R
Seller's Agent in 2015
Robert Mygatt
Group Harmony
Source: IRES MLS
MLS Number: 894841
APN: R1491186
Disclaimer: Certain information contained herein is derived from information provided by parties other than Homes.com. All information provided is deemed reliable, but is not guaranteed to be accurate and should be independently verified.
![]() Information source: Information and Real Estate Services, LLC. Provided for limited non-commercial use only under IRES Rules © Copyright IRES.
Information source: Information and Real Estate Services, LLC. Provided for limited non-commercial use only under IRES Rules © Copyright IRES.
Listing information is provided exclusively for consumers' personal, non-commercial use and may not be used for any purpose other than to identify prospective properties consumers may be interested in purchasing.
Information deemed reliable but not guaranteed by the MLS.