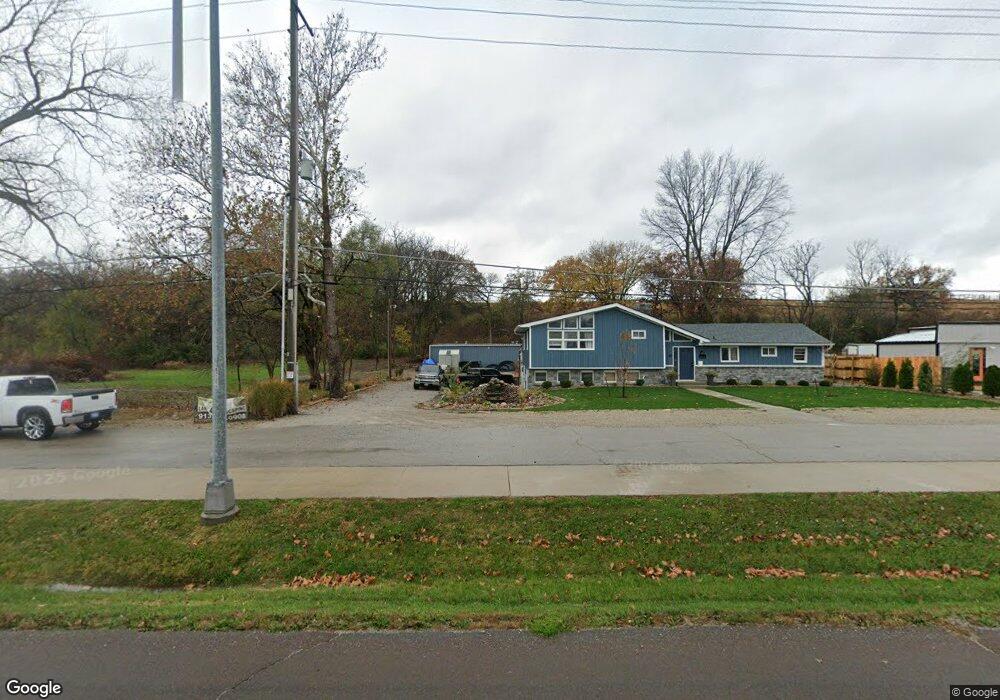
1024 S Main St Lansing, KS 66043
Estimated Value: $211,000 - $414,000
3
Beds
2
Baths
2,400
Sq Ft
$116/Sq Ft
Est. Value
About This Home
This home is located at 1024 S Main St, Lansing, KS 66043 and is currently estimated at $279,376, approximately $116 per square foot. 1024 S Main St is a home located in Leavenworth County with nearby schools including Lansing Elementary School, Lansing Middle 6-8, and Lansing High 9-12.
Ownership History
Date
Name
Owned For
Owner Type
Purchase Details
Closed on
Jun 21, 2021
Sold by
Toro-Valverde Marco L and Toro-Valverde Linda L
Bought by
Ayala J Jesus Delgad
Current Estimated Value
Home Financials for this Owner
Home Financials are based on the most recent Mortgage that was taken out on this home.
Original Mortgage
$140,000
Outstanding Balance
$130,449
Interest Rate
7.5%
Mortgage Type
New Conventional
Estimated Equity
$148,927
Purchase Details
Closed on
Jul 1, 1996
Bought by
Toro and Valverde Marco
Create a Home Valuation Report for This Property
The Home Valuation Report is an in-depth analysis detailing your home's value as well as a comparison with similar homes in the area
Home Values in the Area
Average Home Value in this Area
Purchase History
| Date | Buyer | Sale Price | Title Company |
|---|---|---|---|
| Ayala J Jesus Delgad | $186,200 | Kansas Secured Title | |
| Toro | $5,000 | -- |
Source: Public Records
Mortgage History
| Date | Status | Borrower | Loan Amount |
|---|---|---|---|
| Open | Ayala J Jesus Delgad | $140,000 |
Source: Public Records
Tax History
| Year | Tax Paid | Tax Assessment Tax Assessment Total Assessment is a certain percentage of the fair market value that is determined by local assessors to be the total taxable value of land and additions on the property. | Land | Improvement |
|---|---|---|---|---|
| 2025 | $2,958 | $23,395 | $4,778 | $18,617 |
| 2024 | $2,771 | $22,497 | $5,410 | $17,087 |
| 2023 | $2,771 | $21,632 | $5,410 | $16,222 |
| 2022 | $2,729 | $20,125 | $3,927 | $16,198 |
| 2021 | $1,759 | $12,405 | $3,204 | $9,201 |
| 2020 | $1,701 | $11,814 | $3,091 | $8,723 |
| 2019 | $1,716 | $11,899 | $3,520 | $8,379 |
| 2018 | $1,716 | $11,900 | $4,114 | $7,786 |
| 2017 | $1,668 | $11,553 | $4,114 | $7,439 |
| 2016 | $1,669 | $11,553 | $4,114 | $7,439 |
| 2015 | $1,664 | $11,553 | $3,611 | $7,942 |
| 2014 | $1,580 | $11,216 | $3,611 | $7,605 |
Source: Public Records
Map
Nearby Homes
- 922 Southfork St
- 111 Southfork Rd
- 189 Canyon View Dr
- 811 4-H Rd
- 875 Clearview Dr
- 1322 Rock Creek Ct
- 898 Clearview Dr
- 13788 McIntyre1 Rd
- 13788 Mcintyre Rd
- 13788 McIntyre2 Rd
- 1221 S Desoto Rd
- 202 S Main St
- 124 S Main St
- 24431 139th St
- 218 E Kay St
- 13965 Mc Intyre Rd
- 26731 147th St
- 130 Hampton Ct
- 20958 Ida St
- 129 Crestview Ct
- 101 Rock Creek Loop
- 1006 S Main St
- 100 W Gilman Rd
- 114 W Gilman Rd
- 105 W Gilman Rd
- 0000 W Gilman Rd
- 00000 W Gilman Rd
- 130 W Gilman Rd
- 200 W Gilman Rd
- 210 W Gilman Rd
- 206 W Gilman Rd
- 101 Willow Dr
- 103 Willow Dr
- 121 W Gilman Rd
- 922 S Main St
- 105 Willow Dr
- 292 W Gilman Rd
- 139th Cherokee St
- 102 Willow Dr
- 300 W Gilman Rd
Your Personal Tour Guide
Ask me questions while you tour the home.