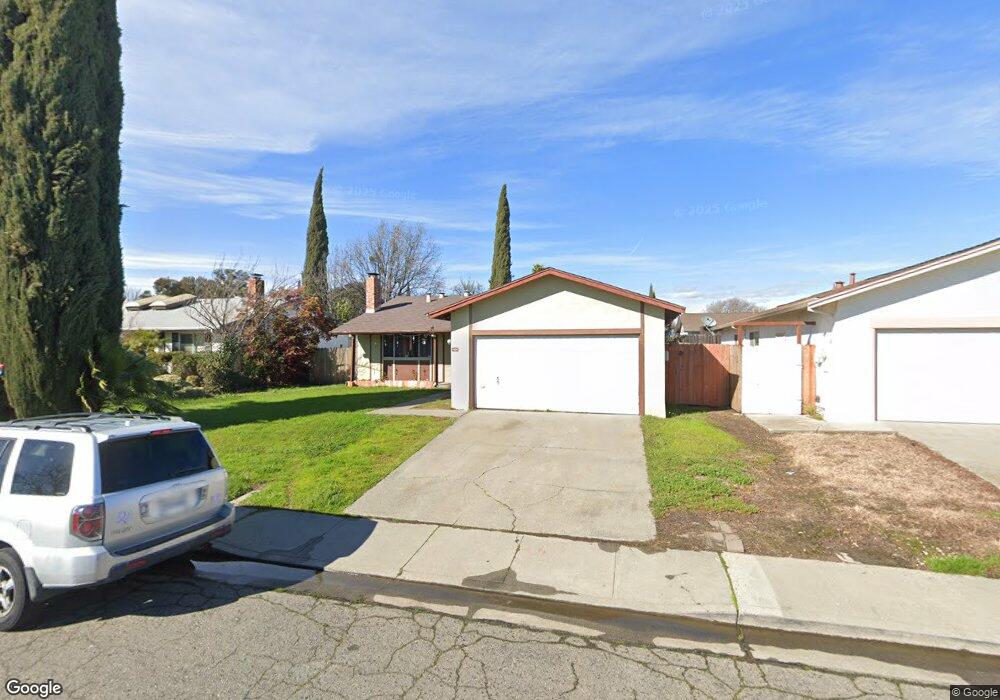
1024 Sparrow Ln Fairfield, CA 94533
Estimated Value: $450,000 - $478,000
3
Beds
1
Bath
1,024
Sq Ft
$448/Sq Ft
Est. Value
About This Home
This home is located at 1024 Sparrow Ln, Fairfield, CA 94533 and is currently estimated at $458,836, approximately $448 per square foot. 1024 Sparrow Ln is a home located in Solano County with nearby schools including Cleo Gordon Elementary School, Grange Middle School, and Fairfield High School.
Ownership History
Date
Name
Owned For
Owner Type
Purchase Details
Closed on
Aug 4, 2005
Sold by
Vega Miguel A and Vega Margaret M
Bought by
Nickleberry Lydell and Hopkins Nickleberry Tanika
Current Estimated Value
Home Financials for this Owner
Home Financials are based on the most recent Mortgage that was taken out on this home.
Original Mortgage
$314,500
Outstanding Balance
$164,786
Interest Rate
5.62%
Mortgage Type
New Conventional
Estimated Equity
$294,050
Purchase Details
Closed on
Aug 2, 1999
Sold by
Sanderson Wayne A and Sanderson Susan
Bought by
Vega Miguel A and Dobrec Margaret M
Home Financials for this Owner
Home Financials are based on the most recent Mortgage that was taken out on this home.
Original Mortgage
$109,542
Interest Rate
7.64%
Mortgage Type
FHA
Purchase Details
Closed on
Jul 8, 1994
Sold by
Sanderson Wayne A and Sanderson Ilse
Bought by
Sanderson Wayne A
Create a Home Valuation Report for This Property
The Home Valuation Report is an in-depth analysis detailing your home's value as well as a comparison with similar homes in the area
Home Values in the Area
Average Home Value in this Area
Purchase History
| Date | Buyer | Sale Price | Title Company |
|---|---|---|---|
| Nickleberry Lydell | $370,000 | Chicago Title Co | |
| Vega Miguel A | $110,500 | Fidelity National Title Co | |
| Sanderson Wayne A | -- | -- |
Source: Public Records
Mortgage History
| Date | Status | Borrower | Loan Amount |
|---|---|---|---|
| Open | Nickleberry Lydell | $314,500 | |
| Previous Owner | Vega Miguel A | $109,542 | |
| Closed | Vega Miguel A | $5,525 |
Source: Public Records
Tax History
| Year | Tax Paid | Tax Assessment Tax Assessment Total Assessment is a certain percentage of the fair market value that is determined by local assessors to be the total taxable value of land and additions on the property. | Land | Improvement |
|---|---|---|---|---|
| 2025 | $5,142 | $458,199 | $59,000 | $399,199 |
| 2024 | $5,142 | $458,199 | $59,000 | $399,199 |
| 2023 | $5,083 | $458,199 | $59,000 | $399,199 |
| 2022 | $5,121 | $458,199 | $59,000 | $399,199 |
| 2021 | $4,451 | $395,000 | $55,000 | $340,000 |
| 2020 | $4,100 | $369,000 | $55,000 | $314,000 |
| 2019 | $4,101 | $371,000 | $59,000 | $312,000 |
| 2018 | $3,681 | $317,000 | $53,000 | $264,000 |
| 2017 | $3,466 | $307,000 | $55,000 | $252,000 |
| 2016 | $2,857 | $251,000 | $47,000 | $204,000 |
| 2015 | $2,366 | $220,000 | $42,000 | $178,000 |
| 2014 | $2,335 | $215,000 | $41,000 | $174,000 |
Source: Public Records
Map
Nearby Homes
- 2049 Swan Way
- 2202 Sandpiper Dr
- 849 Finch Way
- 2013 Cormorant Dr
- 2373 Dawn Way
- 217 Del Luz Ct
- 2386 Baltic Ct
- 1213 Sprig Ct
- 175 Del Sur Ct
- 68 El Toro Ct
- 2429 Baltic Dr
- 237 Del Loma Ct
- 1850 Blossom Ave Unit 115
- 1930 Grande Cir Unit 72
- 1941 Grande Cir Unit 45
- 1941 Grande Cir Unit 48
- 1941 Grande Cir Unit 71
- 50 El Basset Ct Unit 1
- 2275 Dover Ave
- 2219 Channing Ct
Your Personal Tour Guide
Ask me questions while you tour the home.