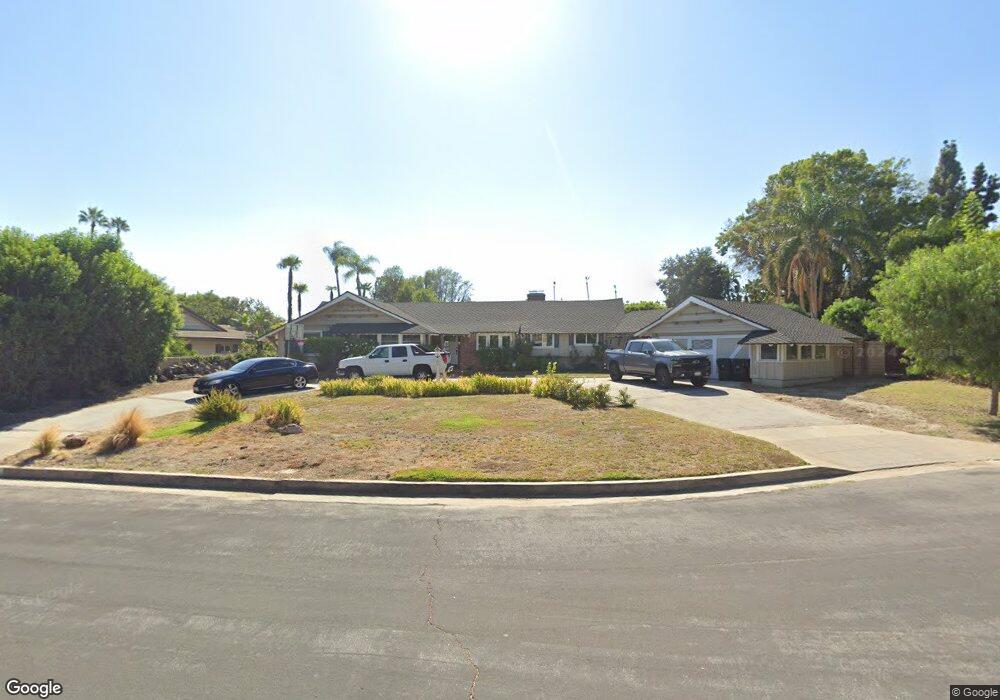
10241 Aura Ave Northridge, CA 91324
Estimated Value: $1,420,000 - $1,647,000
4
Beds
3
Baths
2,533
Sq Ft
$593/Sq Ft
Est. Value
About This Home
This home is located at 10241 Aura Ave, Northridge, CA 91324 and is currently estimated at $1,501,767, approximately $592 per square foot. 10241 Aura Ave is a home located in Los Angeles County with nearby schools including Topeka Charter School For Advanced Studies, Our Community School, and Beckford Charter for Enriched Studies.
Ownership History
Date
Name
Owned For
Owner Type
Purchase Details
Closed on
Aug 18, 2020
Sold by
Walker Gregory Scholl
Bought by
Walker Gregory Scholl and The Gregory Scholl Walker Trus
Current Estimated Value
Purchase Details
Closed on
May 8, 2019
Sold by
Walker Gregory Scholl and Walker Jacquelynne Suzanne
Bought by
Walker Gregory Scholl
Home Financials for this Owner
Home Financials are based on the most recent Mortgage that was taken out on this home.
Original Mortgage
$430,000
Outstanding Balance
$377,289
Interest Rate
4.1%
Mortgage Type
New Conventional
Estimated Equity
$1,124,478
Purchase Details
Closed on
Jun 5, 2001
Sold by
Powers Robert A
Bought by
Walker Gregory Scholl and Walker Jacquelynne Suzanne
Home Financials for this Owner
Home Financials are based on the most recent Mortgage that was taken out on this home.
Original Mortgage
$275,000
Interest Rate
7.21%
Create a Home Valuation Report for This Property
The Home Valuation Report is an in-depth analysis detailing your home's value as well as a comparison with similar homes in the area
Home Values in the Area
Average Home Value in this Area
Purchase History
| Date | Buyer | Sale Price | Title Company |
|---|---|---|---|
| Walker Gregory Scholl | -- | None Available | |
| Walker Gregory Scholl | -- | California Members Title Co | |
| Walker Gregory Scholl | $450,000 | Investors Title Company |
Source: Public Records
Mortgage History
| Date | Status | Borrower | Loan Amount |
|---|---|---|---|
| Open | Walker Gregory Scholl | $430,000 | |
| Previous Owner | Walker Gregory Scholl | $275,000 |
Source: Public Records
Tax History Compared to Growth
Tax History
| Year | Tax Paid | Tax Assessment Tax Assessment Total Assessment is a certain percentage of the fair market value that is determined by local assessors to be the total taxable value of land and additions on the property. | Land | Improvement |
|---|---|---|---|---|
| 2025 | $8,404 | $664,761 | $472,283 | $192,478 |
| 2024 | $8,404 | $651,727 | $463,023 | $188,704 |
| 2023 | $8,249 | $638,949 | $453,945 | $185,004 |
| 2022 | $7,879 | $626,422 | $445,045 | $181,377 |
| 2021 | $7,776 | $614,140 | $436,319 | $177,821 |
| 2019 | $7,553 | $595,927 | $423,379 | $172,548 |
| 2018 | $7,296 | $584,243 | $415,078 | $169,165 |
| 2016 | $6,960 | $561,559 | $398,961 | $162,598 |
| 2015 | $6,860 | $553,125 | $392,969 | $160,156 |
| 2014 | $6,894 | $542,291 | $385,272 | $157,019 |
Source: Public Records
Map
Nearby Homes
- 19530 Tuba St
- 10225 Donna Ave
- 19520 Bermuda St
- 9819 Vanalden Ave
- 19933 Hiawatha St
- 10801 Bothwell Rd
- 19941 Hiawatha St
- 18753 Mayall St
- 10405 Lubao Ave
- 20023 Tipico St
- 20027 Hiawatha St
- 19621 Citronia St
- 9830 Oakdale Ave
- 19559 Tulsa St
- 10116 Viking Ave
- 20115 Romar St
- 19040 Celtic St
- 19354 Halsted St
- 19523 Ballinger St
- 19200 Ballinger St
- 10231 Aura Ave
- 10251 Aura Ave
- 10246 Calvin Ave
- 10232 Calvin Ave
- 10260 Calvin Ave
- 10232 Aura Ave
- 10248 Aura Ave
- 19318 Lemarsh St
- 19308 Lemarsh St
- 19301 Lemarsh St
- 19326 Lemarsh St
- 19411 Hiawatha St
- 10243 Calvin Ave
- 19405 Hiawatha St
- 10253 Calvin Ave
- 10311 Aura Ave
- 10321 Aura Ave
- 10261 Calvin Ave
- 19300 Lemarsh St
- 10301 Aura Ave