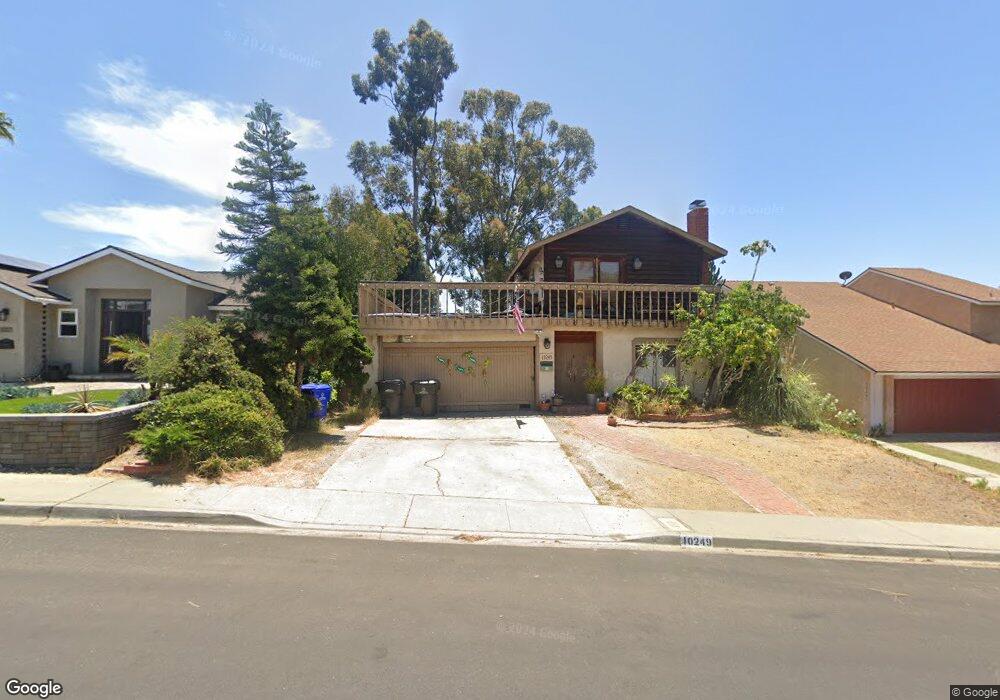
10249 Via Del Sud San Diego, CA 92129
Rancho Peñasquitos NeighborhoodEstimated Value: $1,146,641 - $1,470,000
3
Beds
2
Baths
1,822
Sq Ft
$700/Sq Ft
Est. Value
About This Home
This home is located at 10249 Via Del Sud, San Diego, CA 92129 and is currently estimated at $1,275,160, approximately $699 per square foot. 10249 Via Del Sud is a home located in San Diego County with nearby schools including Los Penasquitos Elementary School, Black Mountain Middle School, and Mt. Carmel High School.
Ownership History
Date
Name
Owned For
Owner Type
Purchase Details
Closed on
Aug 20, 2014
Sold by
Combs Shawn C
Bought by
Combs Shawn C
Current Estimated Value
Purchase Details
Closed on
Dec 10, 2010
Sold by
Combs Mary Lou
Bought by
Combs Mary Lou and Combs Rena P
Create a Home Valuation Report for This Property
The Home Valuation Report is an in-depth analysis detailing your home's value as well as a comparison with similar homes in the area
Home Values in the Area
Average Home Value in this Area
Purchase History
| Date | Buyer | Sale Price | Title Company |
|---|---|---|---|
| Combs Shawn C | -- | None Available | |
| Combs Rena P | -- | None Available | |
| Combs Rena P | -- | None Available | |
| Combs Mary Lou | -- | None Available |
Source: Public Records
Tax History Compared to Growth
Tax History
| Year | Tax Paid | Tax Assessment Tax Assessment Total Assessment is a certain percentage of the fair market value that is determined by local assessors to be the total taxable value of land and additions on the property. | Land | Improvement |
|---|---|---|---|---|
| 2025 | $1,350 | $124,062 | $24,693 | $99,369 |
| 2024 | $1,350 | $121,630 | $24,209 | $97,421 |
| 2023 | $1,319 | $119,246 | $23,735 | $95,511 |
| 2022 | $1,294 | $116,909 | $23,270 | $93,639 |
| 2021 | $1,275 | $114,617 | $22,814 | $91,803 |
| 2020 | $1,257 | $113,443 | $22,581 | $90,862 |
| 2019 | $1,224 | $111,220 | $22,139 | $89,081 |
| 2018 | $1,188 | $109,040 | $21,705 | $87,335 |
| 2017 | $1,154 | $106,903 | $21,280 | $85,623 |
| 2016 | $1,128 | $104,808 | $20,863 | $83,945 |
| 2015 | $1,111 | $103,235 | $20,550 | $82,685 |
| 2014 | $1,085 | $101,214 | $20,148 | $81,066 |
Source: Public Records
Map
Nearby Homes
- 12811 Encantadora Unit 32
- 10202 Vista Lusardi Unit LOT 9
- Plan 1 at Paseo Sereno
- Plan 2 at Paseo Sereno
- Plan 3 at Paseo Sereno
- 10824 Sabre Hill Dr Unit 194
- 10740 Sabre Hill Dr Unit 120
- 10776 Sabre Hill Dr Unit 150
- 13113 Calle de Las Rosas
- 10908 Sabre Hill Dr Unit 322
- 10756 Sabre Hill Dr Unit 265
- 12979 Calle de Las Rosas
- 9959 Azuaga St Unit 105
- 12940 Calle de Las Rosas
- 13015 Evening Creek Dr S Unit 18
- 13009 Evening Creek Dr S Unit 8
- 13039 Evening Creek Dr S Unit 36
- 13330 Caminito Ciera Unit 22
- 12661 Cijon St
- 13327 Caminito Ciera Unit 61
- 10241 Via Del Sud
- 10257 Via Del Sud
- 10233 Via Del Sud
- 10265 Via Del Sud
- 13004 Calle Caballeros
- 10273 Via Del Sud
- 10225 Via Del Sud
- 13003 Avenida Del General
- 13003 Calle Caballeros
- 13016 Calle Caballeros
- 10281 Via Del Sud
- 10217 Via Del Sud
- 1 Rue Du General Leclerc
- 13015 Avenida Del General
- 13015 Calle Caballeros
- 13028 Calle Caballeros
- 10289 Via Del Sud
- 13004 Avenida Grande
- 13027 Calle Caballeros
- 13027 Avenida Del General