1025 Bradley St Saint Paul, MN 55130
Payne-Phalen NeighborhoodEstimated Value: $249,000 - $287,514
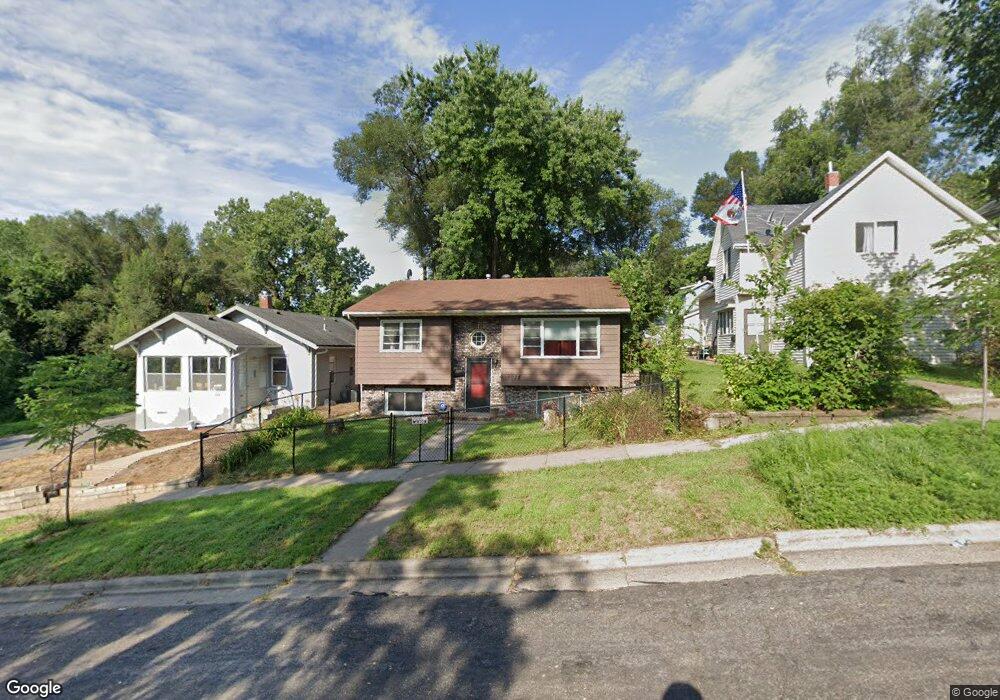
About This Home
This home is located at 1025 Bradley St, Saint Paul, MN 55130 and is currently estimated at $275,379, approximately $213 per square foot. 1025 Bradley St is a home located in Ramsey County with nearby schools including Bruce F Vento Elementary School, Washington Technology Magnet School, and Community Of Peace Academy.
Ownership History
We collect this data history from publicly available records. To have your information removed, we recommend requesting removal directly through your county’s website.
Purchase Details
Home Financials for this Owner
Home Financials are based on the most recent Mortgage that was taken out on this home.Purchase Details
Home Values in the Area
Average Home Value in this Area
Purchase History
We collect this data history from publicly available records. To have your information removed, we recommend requesting removal directly through your county’s website.
| Date | Buyer | Sale Price | Title Company |
|---|---|---|---|
| $149,500 | Titlesmart Inc | ||
| $60,600 | -- |
Mortgage History
We collect this data history from publicly available records. To have your information removed, we recommend requesting removal directly through your county’s website.
| Date | Status | Borrower | Loan Amount |
|---|---|---|---|
| Open | $146,791 |
Tax History
We collect this data history from publicly available records. To have your information removed, we recommend requesting removal directly through your county’s website.
| Year | Tax Paid | Tax Assessment Tax Assessment Total Assessment is a certain percentage of the fair market value that is determined by local assessors to be the total taxable value of land and additions on the property. | Land | Improvement |
|---|---|---|---|---|
| 2025 | $4,046 | $266,800 | $25,000 | $241,800 |
| 2023 | $4,046 | $247,000 | $20,000 | $227,000 |
| 2022 | $3,304 | $227,100 | $20,000 | $207,100 |
| 2021 | $3,244 | $208,000 | $20,000 | $188,000 |
| 2020 | $2,920 | $191,500 | $9,800 | $181,700 |
| 2019 | $2,366 | $180,500 | $9,800 | $170,700 |
| 2018 | $2,232 | $156,200 | $9,800 | $146,400 |
| 2017 | $1,820 | $146,300 | $9,800 | $136,500 |
| 2016 | $2,256 | $0 | $0 | $0 |
| 2015 | $1,976 | $123,500 | $9,800 | $113,700 |
| 2014 | $2,394 | $0 | $0 | $0 |
Map
- 1037 Burr St
- 985 Bradley St
- 1067 Jessie St
- 981 Burr St
- 1038 Edgerton St
- 479 Jessamine Ave E
- 1092 Edgerton St
- 914 Burr St
- 601 Sims Ave
- 1158 Bradley St
- 918 Edgerton St
- 609 Jessamine Ave E
- 508 York Ave
- 372 Lawson Ave E
- 365 Case Ave
- 588 York Ave
- 1178 Jessie St
- 345 Cook Ave E
- 654 Jessamine Ave E
- 350 Jenks Ave
Ask me questions while you tour the home.