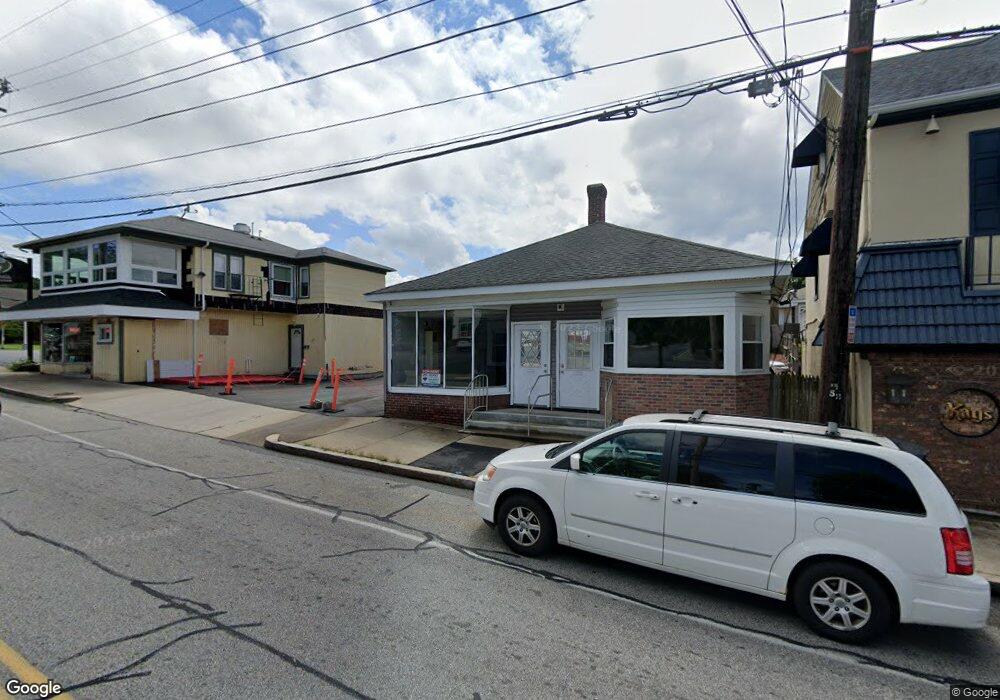
1025 Cass Ave Woonsocket, RI 02895
East Woonsocket NeighborhoodEstimated Value: $283,308
--
Bed
1
Bath
175
Sq Ft
$1,619/Sq Ft
Est. Value
About This Home
This home is located at 1025 Cass Ave, Woonsocket, RI 02895 and is currently estimated at $283,308, approximately $1,618 per square foot. 1025 Cass Ave is a home located in Providence County with nearby schools including Woonsocket High School and Good Shepherd Catholic School.
Ownership History
Date
Name
Owned For
Owner Type
Purchase Details
Closed on
Jun 11, 2002
Sold by
Dias Gabriel B
Bought by
Nelligan Rlty Llc
Current Estimated Value
Purchase Details
Closed on
Jun 25, 1998
Sold by
Perry Edward J and Perry Helen
Bought by
Dias Gabriel B
Home Financials for this Owner
Home Financials are based on the most recent Mortgage that was taken out on this home.
Original Mortgage
$48,000
Interest Rate
7.09%
Mortgage Type
Commercial
Create a Home Valuation Report for This Property
The Home Valuation Report is an in-depth analysis detailing your home's value as well as a comparison with similar homes in the area
Home Values in the Area
Average Home Value in this Area
Purchase History
| Date | Buyer | Sale Price | Title Company |
|---|---|---|---|
| Nelligan Rlty Llc | $102,000 | -- | |
| Nelligan Rlty Llc | $102,000 | -- | |
| Dias Gabriel B | $60,000 | -- | |
| Dias Gabriel B | $60,000 | -- |
Source: Public Records
Mortgage History
| Date | Status | Borrower | Loan Amount |
|---|---|---|---|
| Previous Owner | Dias Gabriel B | $48,000 |
Source: Public Records
Tax History Compared to Growth
Tax History
| Year | Tax Paid | Tax Assessment Tax Assessment Total Assessment is a certain percentage of the fair market value that is determined by local assessors to be the total taxable value of land and additions on the property. | Land | Improvement |
|---|---|---|---|---|
| 2025 | $2,263 | $201,500 | $65,300 | $136,200 |
| 2024 | -- | $150,900 | $54,400 | $96,500 |
| 2023 | $0 | $150,900 | $54,400 | $96,500 |
| 2022 | $0 | $150,900 | $54,400 | $96,500 |
| 2021 | $0 | $122,100 | $41,900 | $80,200 |
| 2020 | $0 | $122,100 | $41,900 | $80,200 |
| 2018 | $0 | $98,100 | $41,900 | $56,200 |
| 2017 | $0 | $111,100 | $42,800 | $68,300 |
| 2016 | $4,290 | $108,500 | $42,800 | $65,700 |
| 2015 | $4,290 | $108,500 | $42,800 | $65,700 |
| 2014 | $4,290 | $112,900 | $47,600 | $65,300 |
Source: Public Records
Map
Nearby Homes