Estimated Value: $367,000 - $453,000
3
Beds
2
Baths
1,528
Sq Ft
$257/Sq Ft
Est. Value
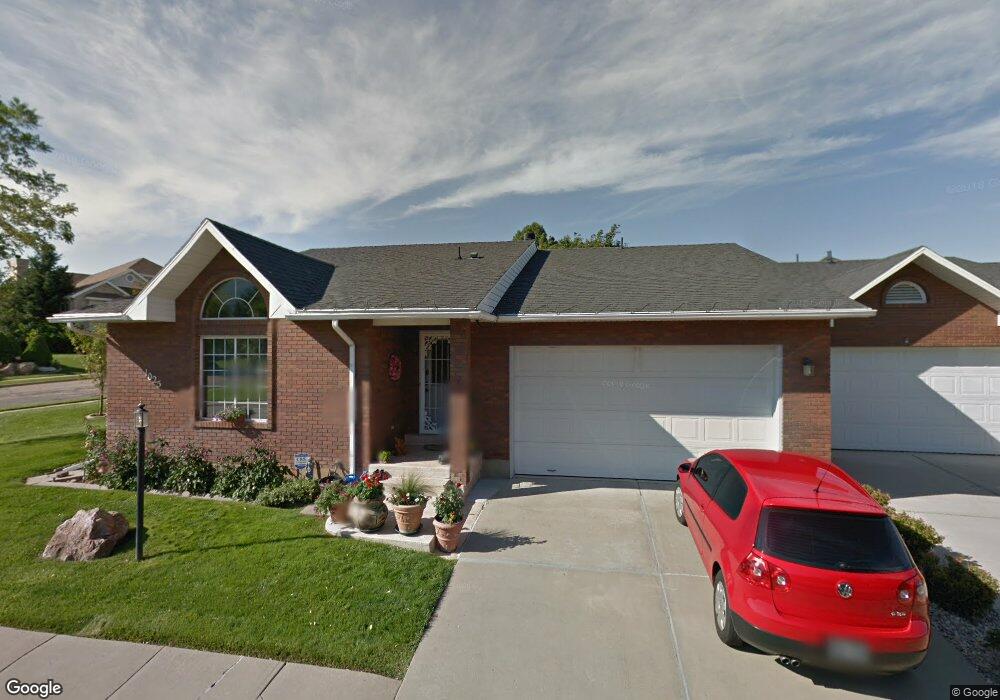
About This Home
This home is located at 1025 E 5775 S, Ogden, UT 84405 and is currently estimated at $392,441, approximately $256 per square foot. 1025 E 5775 S is a home located in Weber County with nearby schools including H Guy Child School, South Ogden Junior High School, and Bonneville High School.
Ownership History
Date
Name
Owned For
Owner Type
Purchase Details
Closed on
Feb 7, 2020
Sold by
Barnard Karen M and Karen M Barnard Trust
Bought by
Barnard Karen M and Karen M Barnard Trust
Current Estimated Value
Purchase Details
Closed on
Sep 18, 2009
Sold by
Barnard Karen M
Bought by
Barnard Karen M
Home Financials for this Owner
Home Financials are based on the most recent Mortgage that was taken out on this home.
Original Mortgage
$50,000
Interest Rate
5.25%
Mortgage Type
Future Advance Clause Open End Mortgage
Purchase Details
Closed on
Jan 20, 1998
Sold by
Barnard Karen M and Barnard Karen M
Bought by
Barnard Karen M
Create a Home Valuation Report for This Property
The Home Valuation Report is an in-depth analysis detailing your home's value as well as a comparison with similar homes in the area
Home Values in the Area
Average Home Value in this Area
Purchase History
| Date | Buyer | Sale Price | Title Company |
|---|---|---|---|
| Barnard Karen M | -- | None Available | |
| Barnard Karen M | -- | Accommodation | |
| Barnard Karen M | -- | Backman Ntp | |
| Barnard Karen M | -- | -- |
Source: Public Records
Mortgage History
| Date | Status | Borrower | Loan Amount |
|---|---|---|---|
| Closed | Barnard Karen M | $50,000 |
Source: Public Records
Tax History
| Year | Tax Paid | Tax Assessment Tax Assessment Total Assessment is a certain percentage of the fair market value that is determined by local assessors to be the total taxable value of land and additions on the property. | Land | Improvement |
|---|---|---|---|---|
| 2025 | $2,328 | $358,750 | $100,000 | $258,750 |
| 2024 | $2,224 | $192,500 | $55,000 | $137,500 |
| 2023 | $2,304 | $200,200 | $55,000 | $145,200 |
| 2022 | $2,409 | $214,500 | $55,000 | $159,500 |
| 2021 | $2,075 | $313,000 | $65,000 | $248,000 |
| 2020 | $2,136 | $302,000 | $40,000 | $262,000 |
| 2019 | $1,930 | $261,000 | $30,000 | $231,000 |
| 2018 | $1,799 | $231,000 | $30,000 | $201,000 |
| 2017 | $1,494 | $185,000 | $30,000 | $155,000 |
| 2016 | $1,457 | $101,750 | $16,500 | $85,250 |
| 2015 | $1,328 | $90,750 | $16,500 | $74,250 |
| 2014 | $1,241 | $83,600 | $16,500 | $67,100 |
Source: Public Records
Map
Nearby Homes
- 994 E 5750 S
- 5760 S 1050 E
- 992 E 5625 S
- 977 E 5550 S
- 5558 S 1025 E
- 845 Cassie Dr
- 856 E 5575 S
- 5540 S 850 E
- 5505 S 1025 E
- 980 E 5475 S
- 5492 S 825 E
- 5813 S Main Point Blvd
- 5523 S 700 E
- 1143 E 5275 S Unit 33
- 5449 S 700 E
- 1205 E 5275 S Unit 34
- 1225 E 5275 S
- 5522 S 600 E
- 1425 E 5850 S Unit 4E
- 1425 E 5850 S Unit 3D
Your Personal Tour Guide
Ask me questions while you tour the home.