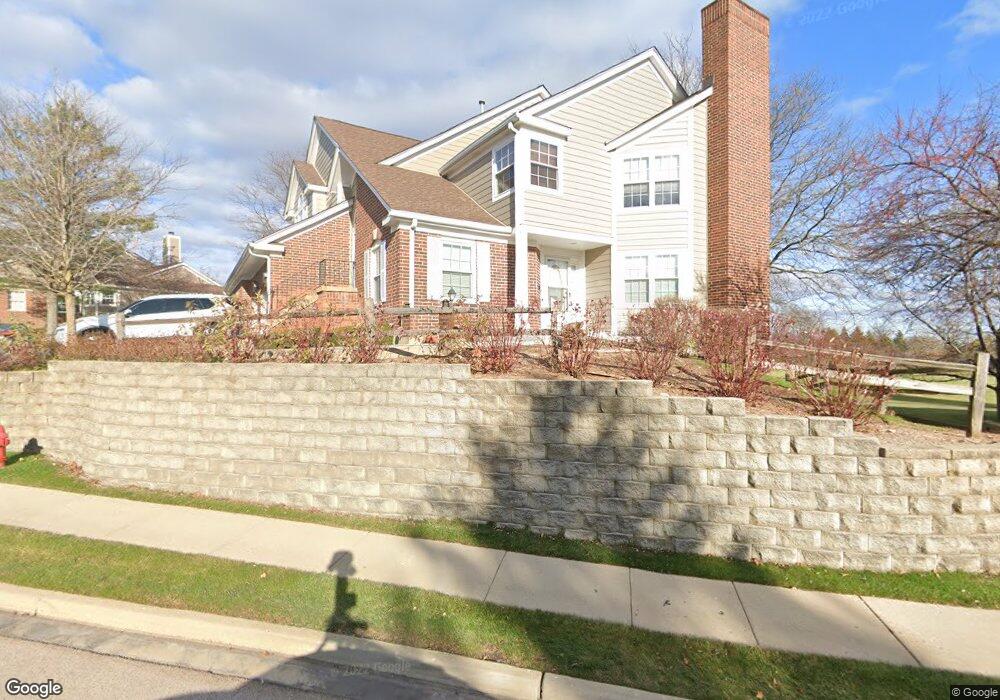
1025 Interloch Ct Unit 42 Algonquin, IL 60102
Estimated Value: $285,000 - $314,000
1
Bed
3
Baths
1,295
Sq Ft
$232/Sq Ft
Est. Value
About This Home
This home is located at 1025 Interloch Ct Unit 42, Algonquin, IL 60102 and is currently estimated at $300,300, approximately $231 per square foot. 1025 Interloch Ct Unit 42 is a home located in McHenry County with nearby schools including Westfield Community School, Kenneth E Neubert Elementary School, and Harry D Jacobs High School.
Ownership History
Date
Name
Owned For
Owner Type
Purchase Details
Closed on
Sep 7, 2017
Sold by
Riddell Scott T
Bought by
Losoff Lawrence
Current Estimated Value
Home Financials for this Owner
Home Financials are based on the most recent Mortgage that was taken out on this home.
Original Mortgage
$146,074
Outstanding Balance
$122,080
Interest Rate
3.93%
Mortgage Type
VA
Estimated Equity
$178,220
Purchase Details
Closed on
Mar 14, 2013
Sold by
Riddell Scott T
Bought by
Riddell Scott T
Purchase Details
Closed on
Nov 30, 2001
Sold by
Riddell Scott
Bought by
Riddell Scott T
Purchase Details
Closed on
Mar 31, 2000
Sold by
Glass James D and Glass Kathy
Bought by
Riddell Scott
Purchase Details
Closed on
Apr 22, 1994
Sold by
Thompson Mark and Thompson Julie
Bought by
Glass James D
Home Financials for this Owner
Home Financials are based on the most recent Mortgage that was taken out on this home.
Original Mortgage
$95,600
Interest Rate
6.37%
Create a Home Valuation Report for This Property
The Home Valuation Report is an in-depth analysis detailing your home's value as well as a comparison with similar homes in the area
Purchase History
| Date | Buyer | Sale Price | Title Company |
|---|---|---|---|
| Losoff Lawrence | $143,000 | Chicago Title | |
| Riddell Scott T | -- | None Available | |
| Riddell Scott T | -- | -- | |
| Riddell Scott | $125,000 | -- | |
| Glass James D | $179,250 | -- |
Source: Public Records
Mortgage History
| Date | Status | Borrower | Loan Amount |
|---|---|---|---|
| Open | Losoff Lawrence | $146,074 | |
| Previous Owner | Glass James D | $95,600 |
Source: Public Records
Tax History
| Year | Tax Paid | Tax Assessment Tax Assessment Total Assessment is a certain percentage of the fair market value that is determined by local assessors to be the total taxable value of land and additions on the property. | Land | Improvement |
|---|---|---|---|---|
| 2024 | $5,016 | $72,126 | $15,898 | $56,228 |
| 2023 | $4,730 | $64,508 | $14,219 | $50,289 |
| 2022 | $4,786 | $61,809 | $22,849 | $38,960 |
| 2021 | $4,577 | $57,583 | $21,287 | $36,296 |
| 2020 | $4,449 | $55,544 | $20,533 | $35,011 |
| 2019 | $4,331 | $53,163 | $19,653 | $33,510 |
| 2018 | $3,915 | $47,072 | $18,155 | $28,917 |
| 2017 | $4,416 | $44,345 | $17,103 | $27,242 |
| 2016 | $4,374 | $41,592 | $16,041 | $25,551 |
| 2013 | -- | $48,040 | $14,965 | $33,075 |
Source: Public Records
Map
Nearby Homes
- 1033 Interloch Ct Unit 32
- 1 N Hubbard St
- SWC Talaga and Algonquin Rd
- 1820 Crofton Dr
- 741 Regal Ln
- 760 Regal Ln
- 700 Fairfield Ln
- 681 Majestic Dr
- 20 Peach Tree Ct Unit 4153
- 18 Peach Tree Ct Unit 4154
- 1105 Spring Hill Dr
- 1157 Sawmill Ln
- 2233 Dawson Ln Unit 312
- 1831 Haverford Dr
- 2069 Peach Tree Ln Unit 4116
- 1920 Jester Ln
- 615 Harper Dr
- 2380 Dawson Ln Unit 165
- 1900 Waverly Ln
- 730 Chestnut Ct
- 1027 Interloch Ct Unit 44
- 1025 Interloch Ct Unit 1025
- 1023 Interloch Ct
- 1021 Interloch Ct Unit 41
- 1031 Interloch Ct Unit 31
- 1026 Interloch Ct Unit 161
- 1007 Interloch Ct Unit 54
- 1007 Interloch Ct Unit 1007
- 1024 Interloch Ct Unit 164
- 1005 Interloch Ct Unit 53
- 1035 Interloch Ct Unit 33
- 1022 Interloch Ct Unit 162
- 1037 Interloch Ct
- 1008 Interloch Ct Unit 153
- 1006 Interloch Ct Unit 151
- 1006 Interloch Ct Unit 1006
- 1004 Interloch Ct Unit 154
- 1002 Interloch Ct Unit 152
- 975 Interloch Ct Unit 63
- 977 Interloch Ct Unit 64