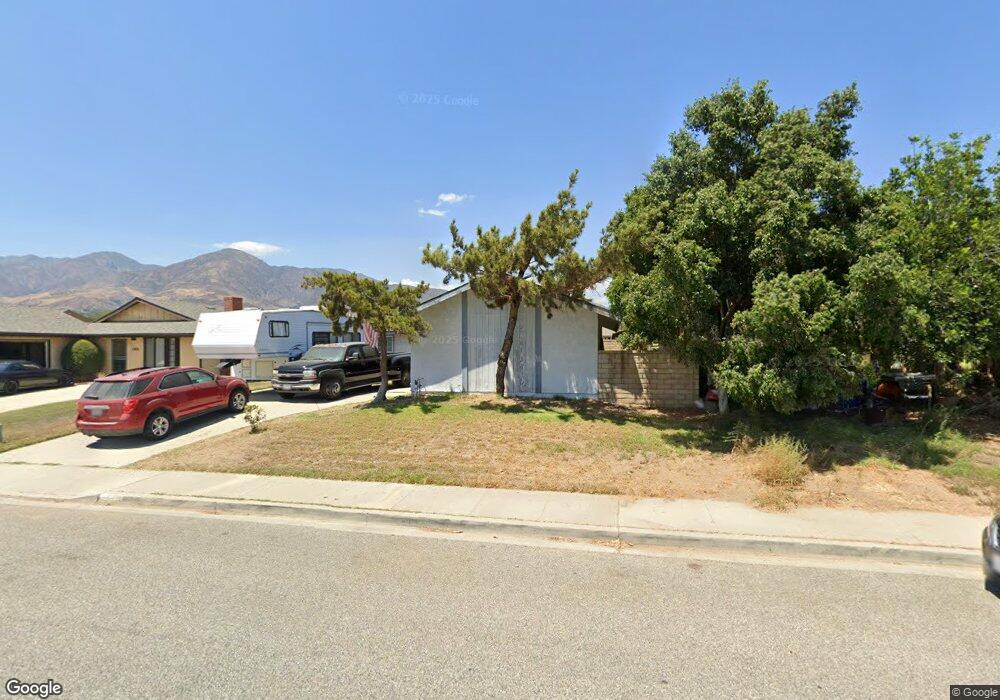
1025 King St Fillmore, CA 93015
Estimated Value: $330,000 - $642,000
3
Beds
2
Baths
1,148
Sq Ft
$452/Sq Ft
Est. Value
About This Home
This home is located at 1025 King St, Fillmore, CA 93015 and is currently estimated at $518,552, approximately $451 per square foot. 1025 King St is a home located in Ventura County with nearby schools including Fillmore Senior High.
Ownership History
Date
Name
Owned For
Owner Type
Purchase Details
Closed on
Nov 1, 2002
Sold by
Va
Bought by
Garcia John A and Garcia Jane B
Current Estimated Value
Purchase Details
Closed on
Jul 28, 1989
Sold by
Denton Jane Yvonne and Garcia Jane Bellew
Bought by
Garcia John A
Create a Home Valuation Report for This Property
The Home Valuation Report is an in-depth analysis detailing your home's value as well as a comparison with similar homes in the area
Home Values in the Area
Average Home Value in this Area
Purchase History
| Date | Buyer | Sale Price | Title Company |
|---|---|---|---|
| Garcia John A | $42,000 | -- | |
| Garcia John A | -- | -- |
Source: Public Records
Tax History
| Year | Tax Paid | Tax Assessment Tax Assessment Total Assessment is a certain percentage of the fair market value that is determined by local assessors to be the total taxable value of land and additions on the property. | Land | Improvement |
|---|---|---|---|---|
| 2025 | $1,037 | $96,478 | $21,896 | $74,582 |
| 2024 | $1,037 | $94,587 | $21,467 | $73,120 |
| 2023 | $1,022 | $92,733 | $21,046 | $71,687 |
| 2022 | $945 | $90,915 | $20,633 | $70,282 |
| 2021 | $1,068 | $89,133 | $20,229 | $68,904 |
| 2020 | $992 | $88,222 | $20,023 | $68,199 |
| 2019 | $993 | $86,493 | $19,631 | $66,862 |
| 2018 | $973 | $84,798 | $19,247 | $65,551 |
| 2017 | $977 | $83,136 | $18,870 | $64,266 |
| 2016 | $906 | $81,506 | $18,500 | $63,006 |
| 2015 | $879 | $80,283 | $18,223 | $62,060 |
| 2014 | $878 | $78,713 | $17,867 | $60,846 |
Source: Public Records
Map
Nearby Homes
- 600 C St
- 1106 Mockingbird Ln
- 313 C St
- 202 Avon Ln
- 320 D St
- 1163 W Ventura St
- 831 Blaine Ave
- 228 Parkhaven Ct
- 809 Woodgrove Rd
- 815 Woodgrove Rd
- 404 Central Ave
- 340 Central Ave
- 586 Apricot Ln
- 578 Apricot Ln
- 549 Heritage Valley Pkwy
- 513 Heritage Valley Pkwy
- 458 Edgewood Dr
- 318 Bard St
- 345 Blaine Ave
- 639 Mountain View St
Your Personal Tour Guide
Ask me questions while you tour the home.