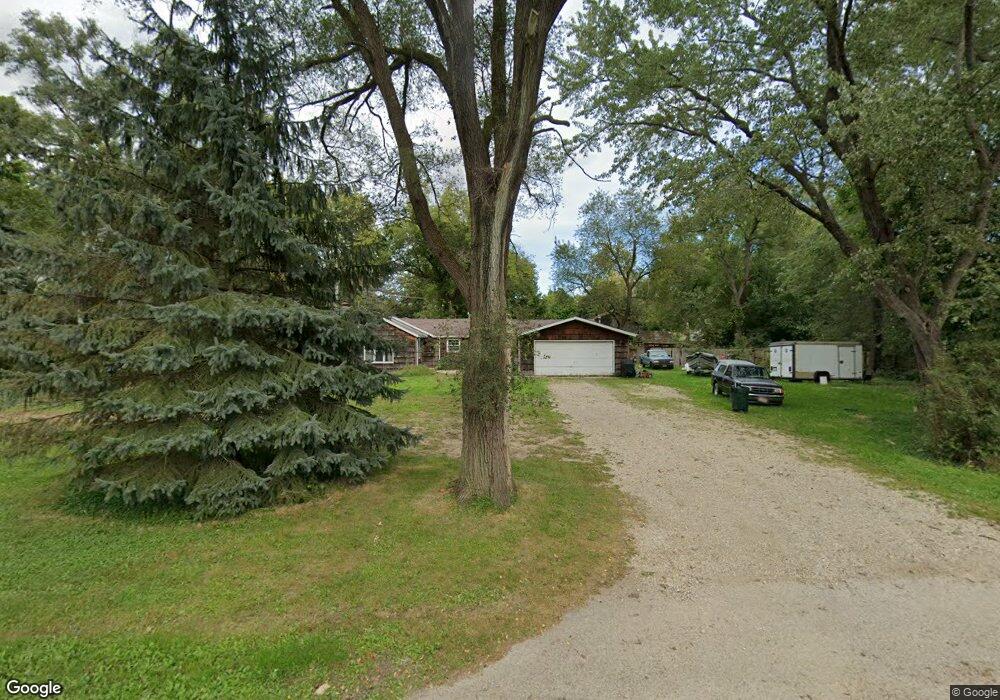
1025 Menoma Trail Algonquin, IL 60102
Estimated Value: $301,922 - $344,000
3
Beds
--
Bath
1,571
Sq Ft
$208/Sq Ft
Est. Value
About This Home
This home is located at 1025 Menoma Trail, Algonquin, IL 60102 and is currently estimated at $326,981, approximately $208 per square foot. 1025 Menoma Trail is a home located in Kane County with nearby schools including Eastview Elementary School, Algonquin Middle School, and Dundee-Crown High School.
Ownership History
Date
Name
Owned For
Owner Type
Purchase Details
Closed on
Oct 28, 1998
Sold by
Hud
Bought by
Kempf Chris L
Current Estimated Value
Purchase Details
Closed on
Aug 4, 1998
Sold by
Schumacher Nancy E and Schumacher John J
Bought by
Hud
Purchase Details
Closed on
Jul 30, 1997
Sold by
Ramsey Kenneth R
Bought by
Hud
Purchase Details
Closed on
Nov 16, 1995
Sold by
Kelley Edward
Bought by
Schumacher John J and Schumacher Nancy E
Home Financials for this Owner
Home Financials are based on the most recent Mortgage that was taken out on this home.
Original Mortgage
$117,587
Interest Rate
7.52%
Mortgage Type
FHA
Purchase Details
Closed on
Jan 13, 1995
Sold by
Kelley Edward and Kelley Carol J
Bought by
Kelley Edward
Home Financials for this Owner
Home Financials are based on the most recent Mortgage that was taken out on this home.
Original Mortgage
$93,600
Interest Rate
6.37%
Create a Home Valuation Report for This Property
The Home Valuation Report is an in-depth analysis detailing your home's value as well as a comparison with similar homes in the area
Home Values in the Area
Average Home Value in this Area
Purchase History
| Date | Buyer | Sale Price | Title Company |
|---|---|---|---|
| Kempf Chris L | -- | Stewart Title | |
| Hud | -- | -- | |
| Hud | -- | -- | |
| Schumacher John J | $121,000 | -- | |
| Kelley Edward | -- | -- |
Source: Public Records
Mortgage History
| Date | Status | Borrower | Loan Amount |
|---|---|---|---|
| Previous Owner | Schumacher John J | $117,587 | |
| Previous Owner | Kelley Edward | $93,600 |
Source: Public Records
Tax History Compared to Growth
Tax History
| Year | Tax Paid | Tax Assessment Tax Assessment Total Assessment is a certain percentage of the fair market value that is determined by local assessors to be the total taxable value of land and additions on the property. | Land | Improvement |
|---|---|---|---|---|
| 2024 | $6,557 | $92,135 | $15,715 | $76,420 |
| 2023 | $6,311 | $82,900 | $14,140 | $68,760 |
| 2022 | $5,592 | $71,581 | $14,140 | $57,441 |
| 2021 | $5,446 | $67,587 | $13,351 | $54,236 |
| 2020 | $5,346 | $66,068 | $13,051 | $53,017 |
| 2019 | $5,211 | $62,718 | $12,389 | $50,329 |
| 2018 | $5,240 | $60,711 | $12,144 | $48,567 |
| 2017 | $5,046 | $56,792 | $11,360 | $45,432 |
| 2016 | $4,518 | $47,865 | $7,915 | $39,950 |
| 2015 | -- | $44,851 | $7,417 | $37,434 |
| 2014 | -- | $43,612 | $7,212 | $36,400 |
| 2013 | -- | $44,947 | $7,433 | $37,514 |
Source: Public Records
Map
Nearby Homes
- lot 25 Wabican Trail
- 0 Natoma Trail
- 1114 Riverwood Dr Unit 1114
- 1245 Winaki Trail
- 69 Alice St
- 9999 Sandbloom Rd
- 1535 Teri Ln
- 1715 Riverwood Dr
- 2 Sunset Ln
- 400 Diamond Back Way
- 600 E Algonquin Rd
- 102 Center St
- 1659 E Algonquin Rd
- Lot 4 b Ryan Pkwy
- 1770 E Algonquin Rd
- 1188 E Algonquin Rd
- 0 River Dr N Unit MRD12473279
- 911 Old Oak Cir Unit 1
- 920 Plymouth Ct
- 903 Old Oak Cir
- 605 Souwanas Trail
- 1065 Menoma Trail
- 1046 Menoma Trail
- 1080 Menoma Trail
- 611 S Vista Dr
- 601 S Vista Dr
- 621 S Vista Dr
- 1070 Manito Trail
- 1105 Menoma Trail
- 1110 Menoma Trail
- 631 S Vista Dr
- 1090 Manito Trail
- 1130 Menoma Trail
- 930 W Vista Dr
- 925 Scott St
- 641 S Vista Dr
- 1135 Menoma Trail
- 919 Scott St
- 651 S Vista Dr
- 19N963 Manito Trail