1025 Phoenix Ct Milpitas, CA 95035
Estimated Value: $1,670,000 - $2,188,000
About This Home
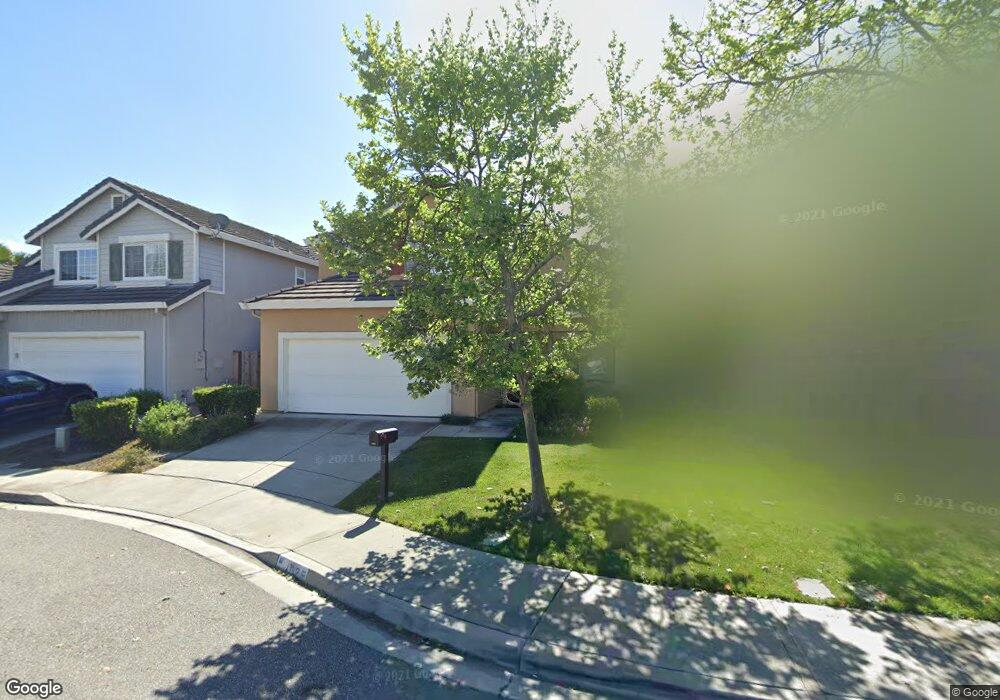
This home is located at 1025 Phoenix Ct, Milpitas, CA 95035 and is currently estimated at $1,965,091, approximately $848 per square foot. 1025 Phoenix Ct is a home located in Santa Clara County with nearby schools including Pearl Zanker Elementary School, Rancho Milpitas Middle School, and Milpitas High School.
Ownership History
We collect this data history from publicly available records. To have your information removed, we recommend requesting removal directly through your county’s website.
Purchase Details
Purchase Details
Home Financials for this Owner
Home Financials are based on the most recent Mortgage that was taken out on this home.Home Values in the Area
Average Home Value in this Area
Purchase History
We collect this data history from publicly available records. To have your information removed, we recommend requesting removal directly through your county’s website.
| Date | Buyer | Sale Price | Title Company |
|---|---|---|---|
| $292,000 | None Listed On Document | ||
| $423,500 | First American Title Guarant |
Mortgage History
We collect this data history from publicly available records. To have your information removed, we recommend requesting removal directly through your county’s website.
| Date | Status | Borrower | Loan Amount |
|---|---|---|---|
| Previous Owner | $310,000 |
Tax History
We collect this data history from publicly available records. To have your information removed, we recommend requesting removal directly through your county’s website.
| Year | Tax Paid | Tax Assessment Tax Assessment Total Assessment is a certain percentage of the fair market value that is determined by local assessors to be the total taxable value of land and additions on the property. | Land | Improvement |
|---|---|---|---|---|
| 2025 | $7,758 | $675,404 | $255,466 | $419,938 |
| 2024 | $7,758 | $662,161 | $250,457 | $411,704 |
| 2023 | $7,732 | $649,179 | $245,547 | $403,632 |
| 2022 | $7,700 | $636,451 | $240,733 | $395,718 |
| 2021 | $7,587 | $623,972 | $236,013 | $387,959 |
| 2020 | $7,455 | $617,574 | $233,593 | $383,981 |
| 2019 | $7,370 | $605,465 | $229,013 | $376,452 |
| 2018 | $7,000 | $593,594 | $224,523 | $369,071 |
| 2017 | $6,909 | $581,956 | $220,121 | $361,835 |
| 2016 | $6,628 | $570,546 | $215,805 | $354,741 |
| 2015 | $6,560 | $561,977 | $212,564 | $349,413 |
| 2014 | $6,380 | $550,970 | $208,401 | $342,569 |
Map
- 1216 Moonlight Way
- 1292 Sunrise Way
- 1101 S Main St Unit 222
- 1101 S Main St Unit 212
- 1101 S Main St Unit 216
- 800 S Abel St Unit 519
- 40 Moon Shadow Dr Unit 282
- 700 S Abel St Unit 415
- 700 S Abel St Unit 317
- 700 S Abel St Unit 417
- 1030 Luz Del Sol Loop Unit 3C
- 915 Ternura Loop
- 62 Parc Place Dr Unit RU3207
- 658 S Main St
- 45 Parc Place Dr Unit RU2808
- 100 Parc Place Dr
- 648 S Main St
- 770 Claridad Loop
- 682 Ohlone St
- 662 Ohlone St
- 1017 Phoenix Ct
- 1033 Phoenix Ct
- 1036 Venus Way
- 1009 Phoenix Ct
- 1028 Venus Way
- 1048 Venus Way
- 1020 Venus Way
- 1001 Phoenix Ct
- 1018 Phoenix Ct
- 1012 Venus Way
- 1010 Phoenix Ct
- 1026 Phoenix Ct
- 1032 Phoenix Ct
- 283 W Capitol Ave
- 291 W Capitol Ave
- 275 W Capitol Ave
- 1002 Phoenix Ct
- 299 W Capitol Ave
- 993 Phoenix Ct
- 267 W Capitol Ave
Ask me questions while you tour the home.