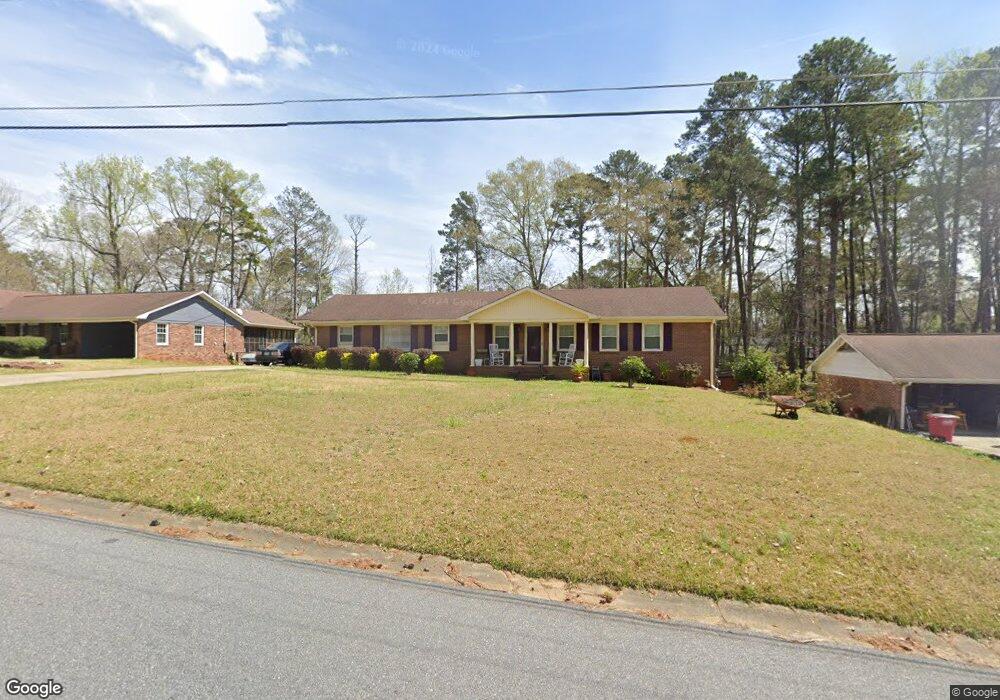
1025 Red Oak Dr Macon, GA 31204
Estimated Value: $169,391 - $217,000
3
Beds
2
Baths
1,496
Sq Ft
$126/Sq Ft
Est. Value
About This Home
This home is located at 1025 Red Oak Dr, Macon, GA 31204 and is currently estimated at $188,598, approximately $126 per square foot. 1025 Red Oak Dr is a home located in Bibb County with nearby schools including Rosa Taylor Elementary School, Howard Middle School, and Howard High School.
Ownership History
Date
Name
Owned For
Owner Type
Purchase Details
Closed on
Mar 6, 2007
Sold by
Nations First Inc
Bought by
Curry Anitra L
Current Estimated Value
Home Financials for this Owner
Home Financials are based on the most recent Mortgage that was taken out on this home.
Original Mortgage
$118,450
Outstanding Balance
$71,853
Interest Rate
6.3%
Mortgage Type
Unknown
Estimated Equity
$116,745
Purchase Details
Closed on
Feb 27, 2007
Sold by
Gmac Mortgage Llc
Bought by
Nations First Inc
Home Financials for this Owner
Home Financials are based on the most recent Mortgage that was taken out on this home.
Original Mortgage
$118,450
Outstanding Balance
$71,853
Interest Rate
6.3%
Mortgage Type
Unknown
Estimated Equity
$116,745
Purchase Details
Closed on
Aug 1, 2006
Purchase Details
Closed on
Aug 5, 2005
Sold by
Coleman Cathy L
Bought by
Sanders Deborah
Home Financials for this Owner
Home Financials are based on the most recent Mortgage that was taken out on this home.
Original Mortgage
$99,920
Interest Rate
8.25%
Mortgage Type
Adjustable Rate Mortgage/ARM
Purchase Details
Closed on
Nov 5, 1999
Create a Home Valuation Report for This Property
The Home Valuation Report is an in-depth analysis detailing your home's value as well as a comparison with similar homes in the area
Home Values in the Area
Average Home Value in this Area
Purchase History
| Date | Buyer | Sale Price | Title Company |
|---|---|---|---|
| Curry Anitra L | $118,500 | None Available | |
| Nations First Inc | -- | None Available | |
| -- | $99,900 | -- | |
| Sanders Deborah | $124,900 | None Available | |
| -- | $94,500 | -- |
Source: Public Records
Mortgage History
| Date | Status | Borrower | Loan Amount |
|---|---|---|---|
| Open | Curry Anitra L | $118,450 | |
| Previous Owner | Sanders Deborah | $99,920 |
Source: Public Records
Tax History Compared to Growth
Tax History
| Year | Tax Paid | Tax Assessment Tax Assessment Total Assessment is a certain percentage of the fair market value that is determined by local assessors to be the total taxable value of land and additions on the property. | Land | Improvement |
|---|---|---|---|---|
| 2024 | $1,222 | $55,114 | $11,040 | $44,074 |
| 2023 | $709 | $52,928 | $11,040 | $41,888 |
| 2022 | $1,425 | $48,159 | $7,700 | $40,459 |
| 2021 | $1,455 | $45,290 | $7,700 | $37,590 |
| 2020 | $1,254 | $39,298 | $6,300 | $32,998 |
| 2019 | $1,208 | $37,864 | $6,300 | $31,564 |
| 2018 | $1,730 | $32,860 | $5,600 | $27,260 |
| 2017 | $940 | $32,079 | $6,254 | $25,825 |
| 2016 | $768 | $29,209 | $6,254 | $22,956 |
| 2015 | $1,267 | $32,860 | $7,035 | $25,825 |
| 2014 | $1,508 | $32,860 | $7,035 | $25,825 |
Source: Public Records
Map
Nearby Homes
- 1017 Clifton Dr
- 1038 Red Oak Dr
- 3185 Willowdale Dr
- 3216 Willowdale Dr
- 1250 Clairmont Place
- 3077 Tiffin Cir
- 3268 Misty Valley Dr
- 3272 Clairmont Ave
- 3280 Willowdale Dr
- 1074 N Pine Knoll Dr
- 782 Wimbish Rd
- 3500 Northside Dr
- 1246 Newport Rd
- 2811 Riverview Rd
- 3602 Northside Dr
- 740 Valley Trail
- 2796 Ellenwood Cir N
- 3622 Northside Dr
- 1019 Red Oak Dr
- 1031 Red Oak Dr
- 1013 Red Oak Dr
- 1024 Clifton Dr
- 1037 Red Oak Dr
- 1018 Clifton Dr
- 1030 Clifton Dr
- 0 Clifton Dr Unit 7407224
- 0 Clifton Dr
- 1026 Red Oak Dr
- 1020 Red Oak Dr
- 1032 Red Oak Dr
- 1012 Clifton Dr
- 1036 Clifton Dr
- 1043 Red Oak Dr
- 1014 Red Oak Dr
- 3097 Clairmont Ave
- 3093 Clairmont Ave
- 1040 Clifton Dr
- 3103 Clairmont Ave