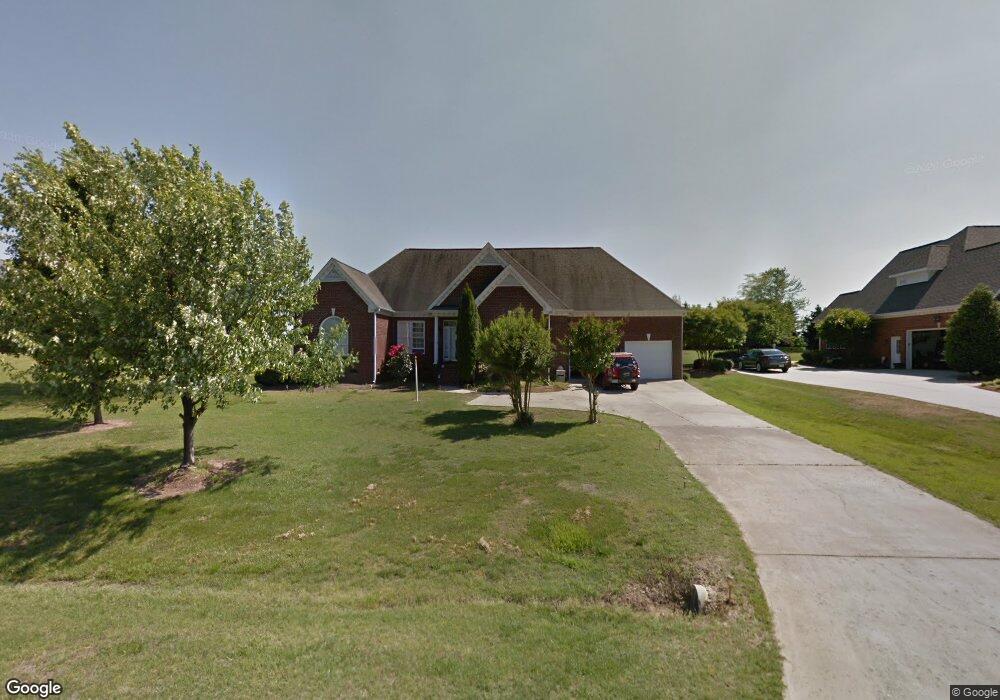
1025 Rolling Farm Dr Raleigh, NC 27603
Estimated Value: $506,000 - $598,000
3
Beds
3
Baths
2,705
Sq Ft
$209/Sq Ft
Est. Value
About This Home
This home is located at 1025 Rolling Farm Dr, Raleigh, NC 27603 and is currently estimated at $564,795, approximately $208 per square foot. 1025 Rolling Farm Dr is a home located in Wake County with nearby schools including Vance Elementary School, North Garner Middle, and Garner High.
Ownership History
Date
Name
Owned For
Owner Type
Purchase Details
Closed on
May 1, 2020
Sold by
Lawhorne Harvey W
Bought by
Kniseley Jeffery A and Kniseley Beth M
Current Estimated Value
Home Financials for this Owner
Home Financials are based on the most recent Mortgage that was taken out on this home.
Original Mortgage
$294,566
Outstanding Balance
$258,250
Interest Rate
2.75%
Mortgage Type
FHA
Estimated Equity
$306,545
Purchase Details
Closed on
Oct 1, 2009
Sold by
Jones Mack Horace and Jones Dolores Mesa
Bought by
Lawhorne Harvey W
Home Financials for this Owner
Home Financials are based on the most recent Mortgage that was taken out on this home.
Original Mortgage
$189,000
Interest Rate
5.1%
Mortgage Type
New Conventional
Purchase Details
Closed on
Dec 17, 2002
Sold by
Branch Banking & Trust Company
Bought by
Jones Mack Horace and Jones Dolores Mesa
Purchase Details
Closed on
Aug 27, 2002
Sold by
Canadian Homes Inc
Bought by
Branch Banking & Trust Company
Create a Home Valuation Report for This Property
The Home Valuation Report is an in-depth analysis detailing your home's value as well as a comparison with similar homes in the area
Home Values in the Area
Average Home Value in this Area
Purchase History
| Date | Buyer | Sale Price | Title Company |
|---|---|---|---|
| Kniseley Jeffery A | $300,000 | None Available | |
| Lawhorne Harvey W | $289,000 | None Available | |
| Jones Mack Horace | $265,000 | -- | |
| Branch Banking & Trust Company | -- | -- |
Source: Public Records
Mortgage History
| Date | Status | Borrower | Loan Amount |
|---|---|---|---|
| Open | Kniseley Jeffery A | $294,566 | |
| Previous Owner | Lawhorne Harvey W | $189,000 |
Source: Public Records
Tax History Compared to Growth
Tax History
| Year | Tax Paid | Tax Assessment Tax Assessment Total Assessment is a certain percentage of the fair market value that is determined by local assessors to be the total taxable value of land and additions on the property. | Land | Improvement |
|---|---|---|---|---|
| 2025 | $3,525 | $548,063 | $100,000 | $448,063 |
| 2024 | $3,423 | $548,063 | $100,000 | $448,063 |
| 2023 | $2,975 | $379,038 | $55,000 | $324,038 |
| 2022 | $2,757 | $379,038 | $55,000 | $324,038 |
| 2021 | $2,684 | $379,038 | $55,000 | $324,038 |
| 2020 | $2,639 | $379,038 | $55,000 | $324,038 |
| 2019 | $2,562 | $311,211 | $45,000 | $266,211 |
| 2018 | $2,322 | $306,726 | $45,000 | $261,726 |
| 2017 | $2,201 | $306,726 | $45,000 | $261,726 |
| 2016 | $2,156 | $306,726 | $45,000 | $261,726 |
| 2015 | $2,400 | $342,759 | $50,000 | $292,759 |
| 2014 | $2,275 | $342,759 | $50,000 | $292,759 |
Source: Public Records
Map
Nearby Homes
- 5000 Trotter Dr
- The Crawford Plan at Laneridge Estates
- The Crawford C Plan at Laneridge Estates
- The Beech Plan at Laneridge Estates
- 5040 Trotter Dr
- 5057 Trotter Dr
- 1329 Wynncrest Ct
- 5060 Trotter Dr
- 4824 Bristol Meadow Dr
- 1121 Whitecroft Dr
- 4705 Trotter Dr
- 1124 Armsleigh Ct
- 2600 Banks Rd Unit Lot 2
- 2600 Banks Rd Unit Lot 1
- 4620 Cresta Dr
- 8529 Hurst Dr
- 51 Cheshire Downs Ct
- 100 Chalcedony St
- 261 Inkster Cove
- 321 Seastone St
- 1021 Rolling Farm Dr
- 1029 Rolling Farm Dr
- 1017 Rolling Farm Dr
- 1033 Rolling Farm Dr
- 1013 Rolling Farm Dr
- 9210 Old Stage Rd
- 1104 Rolling Farm Dr
- 9200 Old Stage Rd
- 1105 Rolling Farm Dr
- 9216 Old Stage Rd
- 1117 Rolling Farm Dr
- 9108 Old Stage Rd
- 9016 Old Stage Rd
- 1121 Rolling Farm Dr
- 9317 Old Stage Rd
- 1128 Rolling Farm Dr
- 9201 Old Stage Rd
- 9104 Old Stage Rd
- 1125 Rolling Farm Dr
- 9321 Old Stage Rd