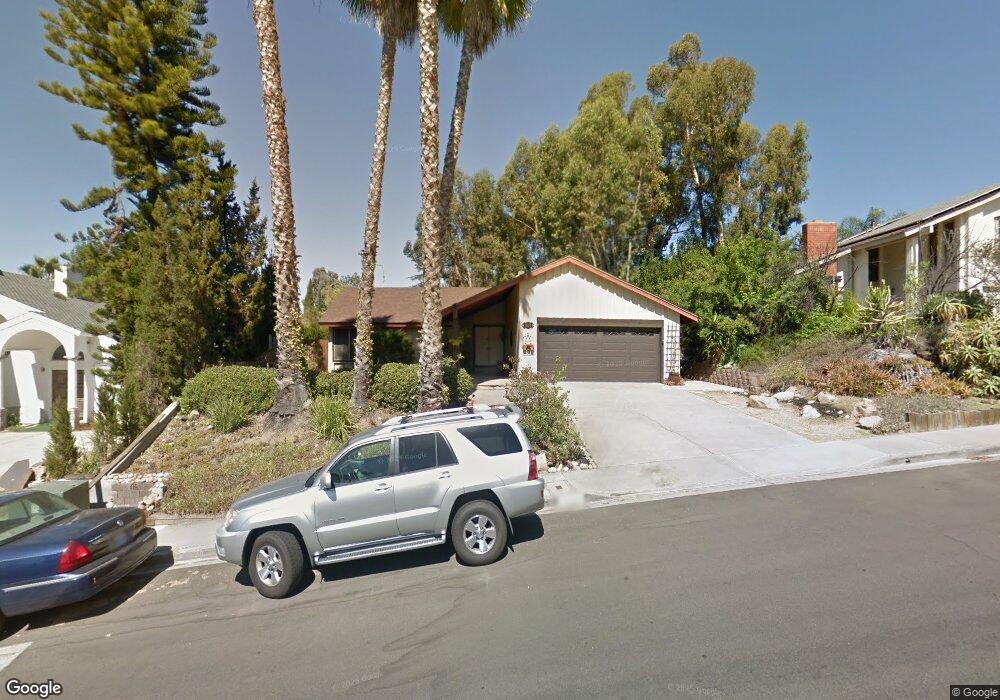
10256 Aviary Dr San Diego, CA 92131
Scripps Ranch NeighborhoodEstimated Value: $1,486,929 - $1,592,000
4
Beds
3
Baths
2,108
Sq Ft
$737/Sq Ft
Est. Value
About This Home
This home is located at 10256 Aviary Dr, San Diego, CA 92131 and is currently estimated at $1,552,982, approximately $736 per square foot. 10256 Aviary Dr is a home located in San Diego County with nearby schools including Miramar Ranch Elementary School, Thurgood Marshall Middle School, and Scripps Ranch High School.
Ownership History
Date
Name
Owned For
Owner Type
Purchase Details
Closed on
Apr 8, 2017
Sold by
Neshat Suzanne and Neshat Andrew
Bought by
The Suzanne Lynn Neshat & Andrew Darian
Current Estimated Value
Purchase Details
Closed on
Dec 14, 1998
Sold by
Neshat Andrew K
Bought by
Neshat Andrew and Neshat Suzanne
Home Financials for this Owner
Home Financials are based on the most recent Mortgage that was taken out on this home.
Original Mortgage
$208,000
Interest Rate
6.86%
Purchase Details
Closed on
Mar 17, 1994
Sold by
Neshat Andrew and Plouff Michael C
Bought by
Neshat Andrew and Neshat Suzanne
Home Financials for this Owner
Home Financials are based on the most recent Mortgage that was taken out on this home.
Original Mortgage
$207,900
Interest Rate
7.21%
Purchase Details
Closed on
Dec 28, 1989
Create a Home Valuation Report for This Property
The Home Valuation Report is an in-depth analysis detailing your home's value as well as a comparison with similar homes in the area
Home Values in the Area
Average Home Value in this Area
Purchase History
| Date | Buyer | Sale Price | Title Company |
|---|---|---|---|
| The Suzanne Lynn Neshat & Andrew Darian | -- | None Available | |
| Neshat Andrew | -- | American Title Co | |
| Neshat Andrew | -- | Southland Title Corporation | |
| -- | $262,000 | -- |
Source: Public Records
Mortgage History
| Date | Status | Borrower | Loan Amount |
|---|---|---|---|
| Previous Owner | Neshat Andrew | $208,000 | |
| Previous Owner | Neshat Andrew | $207,900 |
Source: Public Records
Tax History Compared to Growth
Tax History
| Year | Tax Paid | Tax Assessment Tax Assessment Total Assessment is a certain percentage of the fair market value that is determined by local assessors to be the total taxable value of land and additions on the property. | Land | Improvement |
|---|---|---|---|---|
| 2025 | $7,005 | $565,258 | $267,478 | $297,780 |
| 2024 | $7,005 | $554,176 | $262,234 | $291,942 |
| 2023 | $6,841 | $543,311 | $257,093 | $286,218 |
| 2022 | $6,650 | $532,658 | $252,052 | $280,606 |
| 2021 | $6,320 | $500,214 | $247,110 | $253,104 |
| 2020 | $6,241 | $495,086 | $244,577 | $250,509 |
| 2019 | $6,129 | $485,380 | $239,782 | $245,598 |
| 2018 | $5,735 | $475,864 | $235,081 | $240,783 |
| 2017 | $5,596 | $466,534 | $230,472 | $236,062 |
| 2016 | $5,505 | $457,387 | $225,953 | $231,434 |
| 2015 | $5,421 | $450,517 | $222,559 | $227,958 |
| 2014 | $5,335 | $441,693 | $218,200 | $223,493 |
Source: Public Records
Map
Nearby Homes
- 10265 Aviary Dr
- 10466 Ridgewater Ln
- 10473 Crosscreek Terrace
- 10831 Ironwood Rd
- 10594 Rookwood Dr
- 10535 Arbor Park Place
- 9950 Dichondra Place
- 10280 Caminito Rio Branco
- 10545 Caminito Memosac
- 10447 Caminito Banyon
- 10497 Caminito Mayten
- 10415 Mesa Madera Dr
- 10374 Caminito Banyon Unit U140
- 10343 Caminito Aralia Unit 64
- 10333 Caminito Aralia Unit 70
- 9931 Caminito Tomatillo
- 10263 Caminito Toronjo
- 10276 Caminito Covewood
- 10405 White Birch Dr
- 11825 Miro Cir
- 10264 Aviary Dr
- 10248 Aviary Dr
- 10253 Grayfox Dr
- 10261 Grayfox Dr
- 10272 Aviary Dr
- 10240 Aviary Dr
- 10245 Grayfox Dr
- 10269 Grayfox Dr
- 10870 Aviary Ct
- 10237 Grayfox Dr
- 10275 Grayfox Dr
- 10280 Aviary Dr
- 10232 Aviary Dr
- 10281 Grayfox Dr
- 10229 Grayfox Dr
- 10878 Aviary Ct
- 10875 Aviary Ct
- 10292 Aviary Dr
- 10287 Grayfox Dr
- 10224 Aviary Dr Unit Studio