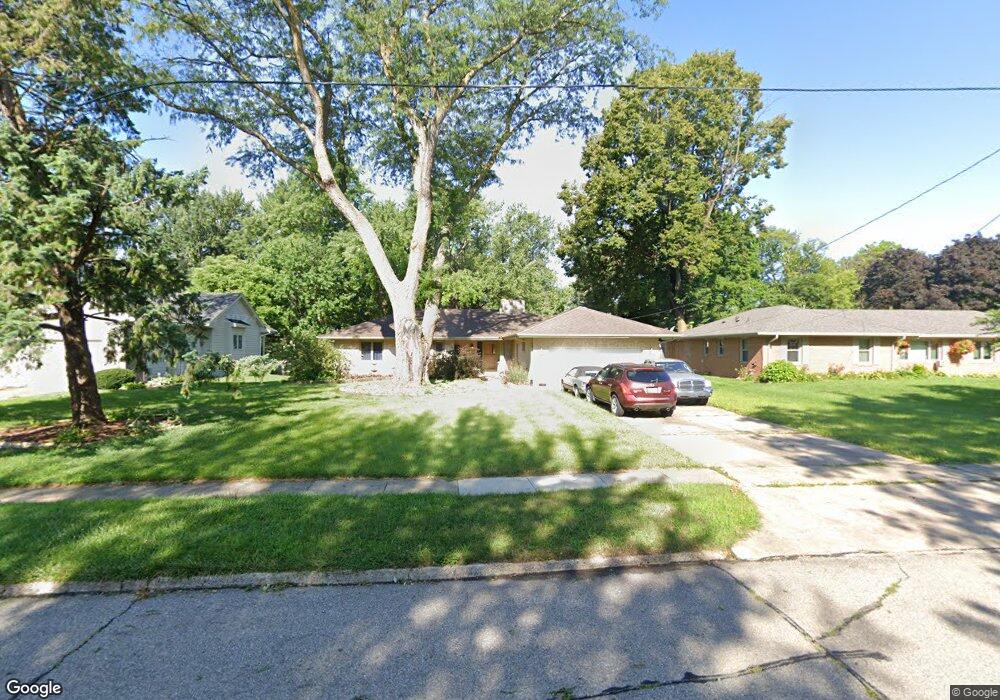
1026 7th St West Des Moines, IA 50265
Estimated Value: $296,000 - $339,000
3
Beds
3
Baths
1,516
Sq Ft
$212/Sq Ft
Est. Value
About This Home
This home is located at 1026 7th St, West Des Moines, IA 50265 and is currently estimated at $321,933, approximately $212 per square foot. 1026 7th St is a home located in Polk County with nearby schools including Hillside Elementary School, Stilwell Junior High School, and Valley Southwoods Freshman High School.
Ownership History
Date
Name
Owned For
Owner Type
Purchase Details
Closed on
Oct 29, 2004
Sold by
Yurka Heather and Yurka Jerry A
Bought by
Boyt Steven H
Current Estimated Value
Home Financials for this Owner
Home Financials are based on the most recent Mortgage that was taken out on this home.
Original Mortgage
$190,000
Interest Rate
5.85%
Mortgage Type
Purchase Money Mortgage
Purchase Details
Closed on
Oct 12, 2000
Sold by
Pearson Virginia L
Bought by
Yurka Heather and Yurka Jerry A
Home Financials for this Owner
Home Financials are based on the most recent Mortgage that was taken out on this home.
Original Mortgage
$114,400
Interest Rate
8.03%
Mortgage Type
Balloon
Create a Home Valuation Report for This Property
The Home Valuation Report is an in-depth analysis detailing your home's value as well as a comparison with similar homes in the area
Home Values in the Area
Average Home Value in this Area
Purchase History
| Date | Buyer | Sale Price | Title Company |
|---|---|---|---|
| Boyt Steven H | $184,500 | -- | |
| Yurka Heather | $142,500 | -- |
Source: Public Records
Mortgage History
| Date | Status | Borrower | Loan Amount |
|---|---|---|---|
| Closed | Boyt Steven H | $190,000 | |
| Previous Owner | Yurka Heather | $114,400 | |
| Closed | Yurka Heather | $21,450 |
Source: Public Records
Tax History Compared to Growth
Tax History
| Year | Tax Paid | Tax Assessment Tax Assessment Total Assessment is a certain percentage of the fair market value that is determined by local assessors to be the total taxable value of land and additions on the property. | Land | Improvement |
|---|---|---|---|---|
| 2025 | $4,264 | $313,900 | $71,100 | $242,800 |
| 2024 | $4,264 | $286,500 | $64,000 | $222,500 |
| 2023 | $4,454 | $286,500 | $64,000 | $222,500 |
| 2022 | $4,400 | $239,500 | $55,500 | $184,000 |
| 2021 | $4,198 | $239,500 | $55,500 | $184,000 |
| 2020 | $4,130 | $217,900 | $50,300 | $167,600 |
| 2019 | $3,926 | $217,900 | $50,300 | $167,600 |
| 2018 | $3,932 | $200,200 | $44,700 | $155,500 |
| 2017 | $3,770 | $200,200 | $44,700 | $155,500 |
| 2016 | $3,684 | $186,900 | $41,100 | $145,800 |
| 2015 | $3,684 | $186,900 | $41,100 | $145,800 |
| 2014 | $3,666 | $184,000 | $39,800 | $144,200 |
Source: Public Records
Map
Nearby Homes
- 720 Valhigh Rd
- 829 7th St
- 2335 SE 5th St
- 686 63rd St
- 701 10th St
- 6513 Center St
- 6420 Center St
- 924 13th St
- 208 Prospect Ave
- 720 63rd St
- 6330 Center St
- 704 12th St
- 608 5th St Unit 2
- 616 4th St
- 800 13th St
- 1426 S Auburn Place
- 529 6th St Unit 2
- Woodland Estates Pla
- 525 6th St Unit 2
- 6750 School St Unit 206