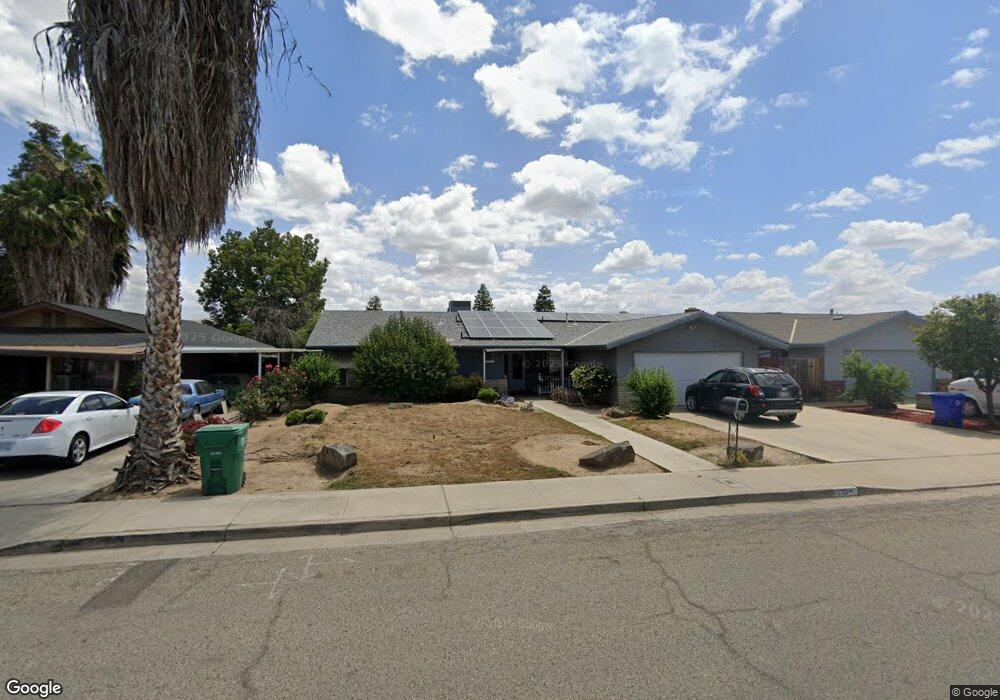
1026 Atkins Way Unit 2 Porterville, CA 93257
Porterville Northwest NeighborhoodEstimated Value: $323,559 - $479,000
3
Beds
2
Baths
1,633
Sq Ft
$227/Sq Ft
Est. Value
About This Home
This home is located at 1026 Atkins Way Unit 2, Porterville, CA 93257 and is currently estimated at $370,890, approximately $227 per square foot. 1026 Atkins Way Unit 2 is a home located in Tulare County with nearby schools including Westfield Elementary School, Sequoia Middle School, and Monache High School.
Ownership History
Date
Name
Owned For
Owner Type
Purchase Details
Closed on
Aug 8, 2002
Sold by
Moore Donnie L
Bought by
Stein Karla Jan
Current Estimated Value
Home Financials for this Owner
Home Financials are based on the most recent Mortgage that was taken out on this home.
Original Mortgage
$107,719
Outstanding Balance
$45,190
Interest Rate
6.43%
Mortgage Type
FHA
Estimated Equity
$325,700
Purchase Details
Closed on
Jun 15, 1999
Sold by
Henschel Darren A
Bought by
Moore Donnie L and Moore Sally A
Home Financials for this Owner
Home Financials are based on the most recent Mortgage that was taken out on this home.
Original Mortgage
$89,387
Interest Rate
7.64%
Mortgage Type
FHA
Purchase Details
Closed on
Oct 6, 1993
Sold by
Henschel Darren A
Bought by
Henschel Darren A and Henschel Susan M
Home Financials for this Owner
Home Financials are based on the most recent Mortgage that was taken out on this home.
Original Mortgage
$94,500
Interest Rate
6.88%
Create a Home Valuation Report for This Property
The Home Valuation Report is an in-depth analysis detailing your home's value as well as a comparison with similar homes in the area
Home Values in the Area
Average Home Value in this Area
Purchase History
| Date | Buyer | Sale Price | Title Company |
|---|---|---|---|
| Stein Karla Jan | $109,000 | Chicago Title Co | |
| Moore Donnie L | $90,000 | Cuesta Title Company | |
| Henschel Darren A | -- | First American Title Ins Co |
Source: Public Records
Mortgage History
| Date | Status | Borrower | Loan Amount |
|---|---|---|---|
| Open | Stein Karla Jan | $107,719 | |
| Previous Owner | Moore Donnie L | $89,387 | |
| Previous Owner | Henschel Darren A | $94,500 |
Source: Public Records
Tax History Compared to Growth
Tax History
| Year | Tax Paid | Tax Assessment Tax Assessment Total Assessment is a certain percentage of the fair market value that is determined by local assessors to be the total taxable value of land and additions on the property. | Land | Improvement |
|---|---|---|---|---|
| 2025 | $1,677 | $157,873 | $36,207 | $121,666 |
| 2024 | $1,677 | $154,779 | $35,498 | $119,281 |
| 2023 | $1,675 | $151,745 | $34,802 | $116,943 |
| 2022 | $1,623 | $148,770 | $34,120 | $114,650 |
| 2021 | $1,604 | $145,853 | $33,451 | $112,402 |
| 2020 | $1,587 | $144,357 | $33,108 | $111,249 |
| 2019 | $1,559 | $141,527 | $32,459 | $109,068 |
| 2018 | $1,531 | $138,752 | $31,823 | $106,929 |
| 2017 | $1,493 | $136,031 | $31,199 | $104,832 |
| 2016 | $1,433 | $133,363 | $30,587 | $102,776 |
| 2015 | $1,379 | $131,360 | $30,128 | $101,232 |
| 2014 | $1,379 | $128,787 | $29,538 | $99,249 |
Source: Public Records
Map
Nearby Homes
- 1076 N Beverly St
- 1045 N Westside St
- 1121 N Lindale Way
- 1041 Greenfield Dr
- 1245 Atkins St
- 1691 Terry Ct
- 1644 Mccomb Ave
- 1681 W Wall Ln
- 1370 Lindale Place
- 1750 W Terry Cir
- 700 N Prospect St
- 1421 Pamela Cir
- 640 N Prospect St
- 1690 Memory Ln
- 1089 Pioneer Ave
- 1450 W Brian Ln
- 1857 W Westfield Ave
- 1730 W Grand Ave
- 0 Pioneer Ave Unit 233651
- 1926 W Nancy Ave
- 1026 Atkins Way
- 1016 Atkins Way
- 1016 Atkins Way
- 1036 Atkins Way
- 1025 N Wilson Place
- 1035 N Wilson Place
- 1015 N Wilson Place
- 1046 Atkins Way
- 1047 N Wilson Place
- 1015 Atkins St
- 1025 Atkins Way
- 1035 Atkins Way
- 1015 Atkins Way
- 1045 N Wilson Place
- 1056 Atkins Way
- 1045 Atkins Way
- 1056 Atkins Way
- 1055 Atkins Way
- 1050 N Wilson Place
- 1026 N Wilson Place