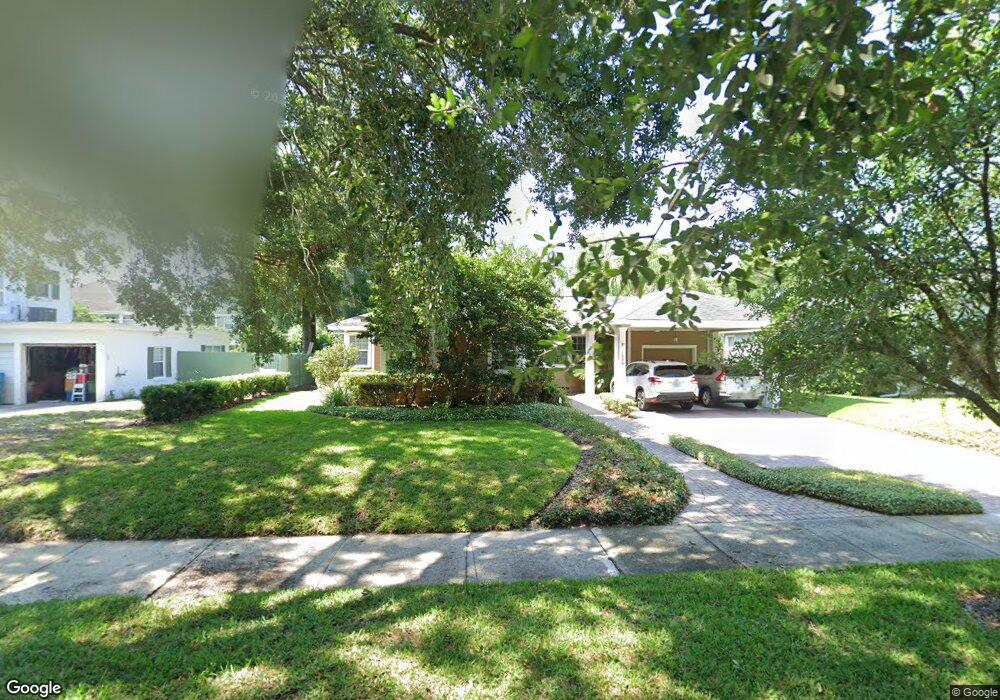
1026 Chichester St Orlando, FL 32803
Orwin Manor NeighborhoodEstimated Value: $735,000 - $794,000
3
Beds
2
Baths
2,129
Sq Ft
$359/Sq Ft
Est. Value
About This Home
This home is located at 1026 Chichester St, Orlando, FL 32803 and is currently estimated at $763,884, approximately $358 per square foot. 1026 Chichester St is a home located in Orange County with nearby schools including Princeton Elementary School, College Park Middle School, and Edgewater High School.
Ownership History
Date
Name
Owned For
Owner Type
Purchase Details
Closed on
Sep 30, 2005
Sold by
Johnston Robert F
Bought by
Goodpasture John and Goodpasture Ann C
Current Estimated Value
Home Financials for this Owner
Home Financials are based on the most recent Mortgage that was taken out on this home.
Original Mortgage
$200,000
Outstanding Balance
$107,117
Interest Rate
5.77%
Mortgage Type
Fannie Mae Freddie Mac
Estimated Equity
$656,767
Purchase Details
Closed on
Mar 9, 2001
Sold by
Roquemore Margaret E Trust C
Bought by
Johnston Robert Ii F
Home Financials for this Owner
Home Financials are based on the most recent Mortgage that was taken out on this home.
Original Mortgage
$27,750
Interest Rate
7.12%
Mortgage Type
New Conventional
Purchase Details
Closed on
Aug 25, 1997
Sold by
David W Roquemore Jr Tr and Sara R Gonzalez Tr
Bought by
Roquemore Jr Tr David W and Gonzalez Sara R
Purchase Details
Closed on
Nov 9, 1993
Sold by
Roquemore Margaret Elizabeth
Bought by
Roquemore David W
Create a Home Valuation Report for This Property
The Home Valuation Report is an in-depth analysis detailing your home's value as well as a comparison with similar homes in the area
Home Values in the Area
Average Home Value in this Area
Purchase History
| Date | Buyer | Sale Price | Title Company |
|---|---|---|---|
| Goodpasture John | $315,000 | -- | |
| Johnston Robert Ii F | $92,500 | -- | |
| Johnston Robert Ii F | $92,500 | -- | |
| Roquemore Jr Tr David W | $100 | -- | |
| Roquemore David W | -- | -- |
Source: Public Records
Mortgage History
| Date | Status | Borrower | Loan Amount |
|---|---|---|---|
| Open | Goodpasture John | $200,000 | |
| Previous Owner | Roquemore Jr Tr David W | $27,750 |
Source: Public Records
Tax History Compared to Growth
Tax History
| Year | Tax Paid | Tax Assessment Tax Assessment Total Assessment is a certain percentage of the fair market value that is determined by local assessors to be the total taxable value of land and additions on the property. | Land | Improvement |
|---|---|---|---|---|
| 2025 | $4,767 | $301,719 | -- | -- |
| 2024 | $4,537 | $301,719 | -- | -- |
| 2023 | $4,537 | $284,676 | $0 | $0 |
| 2022 | $4,401 | $276,384 | $0 | $0 |
| 2021 | $4,327 | $268,334 | $0 | $0 |
| 2020 | $4,118 | $264,629 | $0 | $0 |
| 2019 | $4,241 | $258,679 | $0 | $0 |
| 2018 | $4,197 | $253,856 | $0 | $0 |
| 2017 | $4,139 | $351,222 | $140,000 | $211,222 |
| 2016 | $4,118 | $346,297 | $140,000 | $206,297 |
| 2015 | $4,176 | $334,572 | $140,000 | $194,572 |
| 2014 | $4,195 | $244,268 | $110,000 | $134,268 |
Source: Public Records
Map
Nearby Homes
- 1010 Garden Dr
- 805 Nottingham St
- 1245 Munster St
- 1564 Cavendish Rd
- 1473 Berkshire Ave
- 3207 Middlesex Rd
- 915 Garden Dr
- 3223 N Orange Ave
- 1340 Pelham Rd
- 1261 Indiana Ave
- 1510 Miller Ave
- 1250 S Denning Dr Unit 213
- 1417 Miller Ave
- 1540 Miller Ave
- 1275 Michigan Ave
- 1311 Lake Shore Dr
- 1737 Indiana Ave
- 2505 Norfolk Rd
- 700 Melrose Ave Unit D21
- 700 Melrose Ave Unit J23
- 1114 Chichester St
- 1020 Chichester St
- 1100 Chichester St
- 1025 Wilkinson St
- 1016 Chichester St
- 1106 Chichester St
- 1101 Wilkinson St
- 1027 Chichester St
- 1015 Wilkinson St
- 1105 Wilkinson St
- 1101 Chichester St
- 1006 Chichester St
- 1111 Wilkinson St
- 1007 Wilkinson St
- 1009 Chichester St
- 1115 Chichester St
- 1000 Chichester St
- 1115 Wilkinson St
- 1024 Nottingham St
- 1030 Nottingham St