
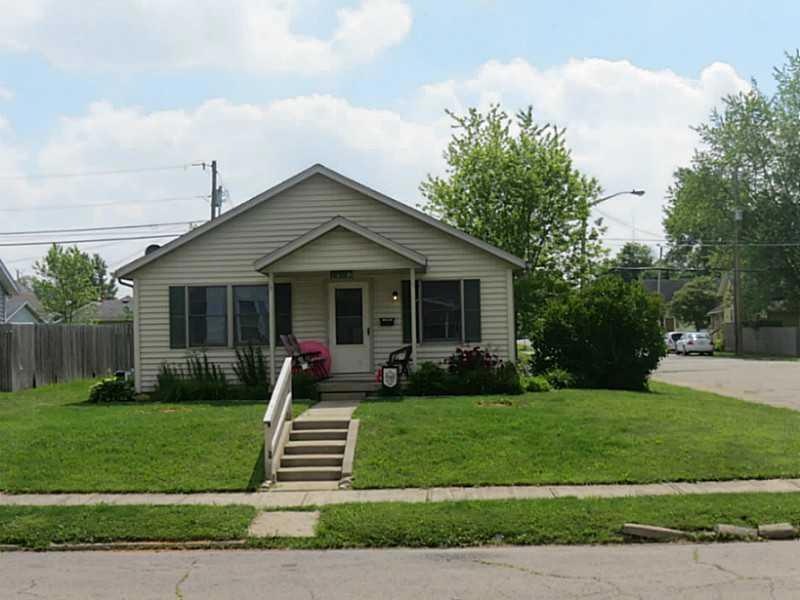
1026 S 19th St New Castle, IN 47362
New Castle Neighborhood
3
Beds
1
Bath
1,008
Sq Ft
7,841
Sq Ft Lot
Highlights
- Ranch Style House
- Eat-In Kitchen
- Forced Air Heating System
- No HOA
- Walk-In Closet
About This Home
As of February 2023Beautiful three bedroom home on a corner lot. Open eat-in kitchen with large island. Updated bathroom with large built in laundry closet. Nice utility room. Large backyard with shed. Central air and water heater are only four years old.
Last Agent to Sell the Property
Matthew Huffman
F.C. Tucker/Crossroads Real Estate
Last Buyer's Agent
Matthew Huffman
F.C. Tucker/Crossroads Real Estate
Home Details
Home Type
- Single Family
Year Built
- Built in 1999
Lot Details
- 7,841 Sq Ft Lot
Home Design
- Ranch Style House
- Vinyl Siding
Interior Spaces
- 1,008 Sq Ft Home
- Vinyl Clad Windows
- Laminate Flooring
- Crawl Space
Kitchen
- Eat-In Kitchen
- Electric Oven
- Microwave
- Dishwasher
Bedrooms and Bathrooms
- 3 Bedrooms
- Walk-In Closet
- 1 Full Bathroom
Utilities
- Forced Air Heating System
- Heating System Uses Gas
- Gas Water Heater
Community Details
- No Home Owners Association
- First Industrial Subdivision
Listing and Financial Details
- Tax Lot 391
- Assessor Parcel Number 331214320205000016
Ownership History
Date
Name
Owned For
Owner Type
Purchase Details
Listed on
Nov 23, 2022
Closed on
Feb 15, 2023
Sold by
Wilkinson Sarah
Bought by
Lane Harrison
Seller's Agent
Edie Day
F.C. Tucker/Crossroads Real Estate
Buyer's Agent
Diana Martin
NonMember MEIAR
List Price
$119,500
Sold Price
$107,500
Premium/Discount to List
-$12,000
-10.04%
Total Days on Market
185
Views
49
Current Estimated Value
Home Financials for this Owner
Home Financials are based on the most recent Mortgage that was taken out on this home.
Estimated Appreciation
$14,891
Avg. Annual Appreciation
5.88%
Purchase Details
Listed on
Jun 5, 2015
Closed on
Feb 22, 2016
Sold by
Raines Hughes Tonya J
Bought by
Wilkinson Sarah
Seller's Agent
Matthew Huffman
F.C. Tucker/Crossroads Real Estate
Buyer's Agent
Matthew Huffman
F.C. Tucker/Crossroads Real Estate
List Price
$45,900
Sold Price
$41,250
Premium/Discount to List
-$4,650
-10.13%
Home Financials for this Owner
Home Financials are based on the most recent Mortgage that was taken out on this home.
Avg. Annual Appreciation
14.71%
Original Mortgage
$40,000
Interest Rate
3.92%
Mortgage Type
New Conventional
Map
Create a Home Valuation Report for This Property
The Home Valuation Report is an in-depth analysis detailing your home's value as well as a comparison with similar homes in the area
Similar Homes in New Castle, IN
Home Values in the Area
Average Home Value in this Area
Purchase History
| Date | Type | Sale Price | Title Company |
|---|---|---|---|
| Deed | $107,500 | Trademark Title | |
| Warranty Deed | -- | None Available |
Source: Public Records
Mortgage History
| Date | Status | Loan Amount | Loan Type |
|---|---|---|---|
| Previous Owner | $40,000 | New Conventional |
Source: Public Records
Property History
| Date | Event | Price | Change | Sq Ft Price |
|---|---|---|---|---|
| 02/15/2023 02/15/23 | Sold | $107,500 | -6.4% | $107 / Sq Ft |
| 01/15/2023 01/15/23 | Pending | -- | -- | -- |
| 01/03/2023 01/03/23 | Price Changed | $114,900 | -3.8% | $114 / Sq Ft |
| 11/23/2022 11/23/22 | For Sale | $119,500 | +189.7% | $119 / Sq Ft |
| 02/23/2016 02/23/16 | Sold | $41,250 | -10.1% | $41 / Sq Ft |
| 12/08/2015 12/08/15 | Pending | -- | -- | -- |
| 09/29/2015 09/29/15 | For Sale | $45,900 | +11.3% | $46 / Sq Ft |
| 09/22/2015 09/22/15 | Off Market | $41,250 | -- | -- |
| 09/17/2015 09/17/15 | Price Changed | $45,900 | -6.3% | $46 / Sq Ft |
| 07/20/2015 07/20/15 | Price Changed | $49,000 | -14.0% | $49 / Sq Ft |
| 06/05/2015 06/05/15 | For Sale | $57,000 | -- | $57 / Sq Ft |
Source: MIBOR Broker Listing Cooperative®
Tax History
| Year | Tax Paid | Tax Assessment Tax Assessment Total Assessment is a certain percentage of the fair market value that is determined by local assessors to be the total taxable value of land and additions on the property. | Land | Improvement |
|---|---|---|---|---|
| 2024 | $907 | $90,700 | $13,600 | $77,100 |
| 2023 | $702 | $78,600 | $13,600 | $65,000 |
| 2022 | $608 | $66,900 | $9,100 | $57,800 |
| 2021 | $532 | $58,400 | $9,100 | $49,300 |
| 2020 | $533 | $56,100 | $9,100 | $47,000 |
| 2019 | $510 | $55,400 | $9,100 | $46,300 |
| 2018 | $465 | $54,300 | $8,200 | $46,100 |
| 2017 | $437 | $54,200 | $8,200 | $46,000 |
| 2016 | $530 | $64,000 | $9,700 | $54,300 |
| 2014 | $1,328 | $66,000 | $11,900 | $54,100 |
| 2013 | $1,328 | $64,100 | $11,900 | $52,200 |
Source: Public Records
Source: MIBOR Broker Listing Cooperative®
MLS Number: 21357545
APN: 33-12-14-320-205.000-016
Disclaimer: Certain information contained herein is derived from information provided by parties other than Homes.com. All information provided is deemed reliable, but is not guaranteed to be accurate and should be independently verified.
![]() Based on information submitted to the MLS GRID. All data is obtained from various sources and may not have been verified by broker or MLS GRID. Supplied Open House Information is subject to change without notice. All information should be independently reviewed and verified for accuracy. Properties may or may not be listed by the office/agent presenting the information. Some IDX listings have been excluded from this website.
Based on information submitted to the MLS GRID. All data is obtained from various sources and may not have been verified by broker or MLS GRID. Supplied Open House Information is subject to change without notice. All information should be independently reviewed and verified for accuracy. Properties may or may not be listed by the office/agent presenting the information. Some IDX listings have been excluded from this website.
Nearby Homes