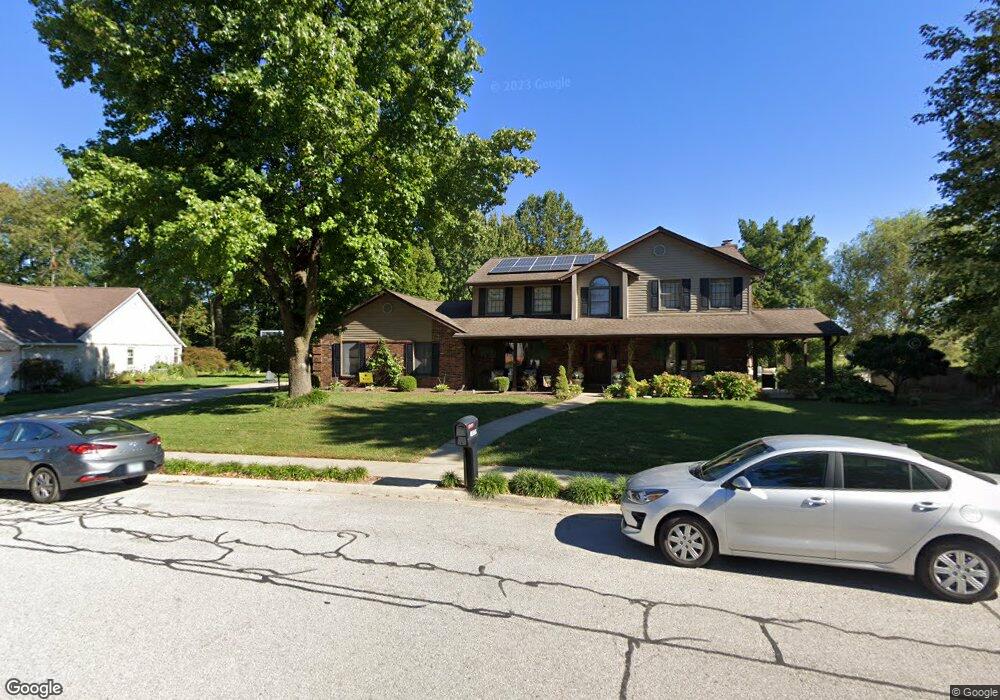
1026 Shadow Ridge Crossing O Fallon, IL 62269
Estimated Value: $351,000 - $413,000
4
Beds
3
Baths
3,250
Sq Ft
$120/Sq Ft
Est. Value
About This Home
This home is located at 1026 Shadow Ridge Crossing, O Fallon, IL 62269 and is currently estimated at $390,071, approximately $120 per square foot. 1026 Shadow Ridge Crossing is a home located in St. Clair County with nearby schools including Kampmeyer Elementary School, Carriel Junior High School, and O'Fallon Township High School.
Ownership History
Date
Name
Owned For
Owner Type
Purchase Details
Closed on
Dec 11, 2009
Sold by
Sanders Bradley O and Sanders Deborah S
Bought by
Little Jason B and Little Ann M
Current Estimated Value
Home Financials for this Owner
Home Financials are based on the most recent Mortgage that was taken out on this home.
Original Mortgage
$247,435
Outstanding Balance
$163,122
Interest Rate
5.11%
Mortgage Type
FHA
Estimated Equity
$226,949
Purchase Details
Closed on
Apr 30, 2001
Sold by
Stovall Ronald M and Stovall Barbara M
Bought by
Sanders Bradley O and Sanders Deborah S
Home Financials for this Owner
Home Financials are based on the most recent Mortgage that was taken out on this home.
Original Mortgage
$80,000
Interest Rate
6.99%
Create a Home Valuation Report for This Property
The Home Valuation Report is an in-depth analysis detailing your home's value as well as a comparison with similar homes in the area
Home Values in the Area
Average Home Value in this Area
Purchase History
| Date | Buyer | Sale Price | Title Company |
|---|---|---|---|
| Little Jason B | $252,000 | Pti | |
| Sanders Bradley O | $228,000 | Metro East Title Corp |
Source: Public Records
Mortgage History
| Date | Status | Borrower | Loan Amount |
|---|---|---|---|
| Open | Little Jason B | $247,435 | |
| Previous Owner | Sanders Bradley O | $80,000 |
Source: Public Records
Tax History
| Year | Tax Paid | Tax Assessment Tax Assessment Total Assessment is a certain percentage of the fair market value that is determined by local assessors to be the total taxable value of land and additions on the property. | Land | Improvement |
|---|---|---|---|---|
| 2024 | $8,480 | $122,332 | $28,348 | $93,984 |
| 2023 | $7,772 | $108,575 | $25,160 | $83,415 |
| 2022 | $7,312 | $99,820 | $23,131 | $76,689 |
| 2021 | $6,981 | $93,932 | $23,204 | $70,728 |
| 2020 | $6,924 | $88,915 | $21,965 | $66,950 |
| 2019 | $6,758 | $88,915 | $21,965 | $66,950 |
| 2018 | $7,212 | $94,171 | $21,327 | $72,844 |
| 2017 | $6,100 | $77,848 | $19,533 | $58,315 |
| 2016 | $6,078 | $76,031 | $19,077 | $56,954 |
| 2014 | $5,613 | $75,151 | $18,856 | $56,295 |
| 2013 | $5,942 | $85,244 | $20,423 | $64,821 |
Source: Public Records
Map
Nearby Homes
- 1005 Greentrail Ct
- 622 Saint Nicholas Dr
- 1001 Ramblewood Dr
- 624 Wildwood Ln
- 1104 N Smiley St
- 605 Wildwood Ln
- 621 E Wesley Dr
- 620 Springhill Ct
- 914 Reiss Rd
- 708 N Smiley St
- 604 N Smiley St
- 26 Ravenwood Cir
- 504 Fontainebleau
- 518 Deer Creek Rd
- 809 E Deer Creek Rd
- 109 Sherryl Ct
- 408 E Washington St
- 104 W Jackson St
- 904 MacEs Grove Rd
- 0 Glen Hollow Dr
- 1022 Shadow Ridge Crossing
- 1030 Shadow Ridge Crossing
- 1018 Shadow Ridge Crossing
- 1027 Shadow Ridge Crossing
- 1034 Shadow Ridge Crossing
- 1009 Woodlake Ct
- 1023 Shadow Ridge Crossing
- 1014 Shadow Ridge Crossing
- 804 Saint Nicholas Dr
- 1035 Shadow Ridge Crossing
- 1006 Woodlake Ct
- 1038 Shadow Ridge Crossing
- 1019 Shadow Ridge Crossing
- 1005 Woodlake Ct
- 1002 Greentrail Ct
- 1010 Shadow Ridge Crossing
- 1006 Greentrail Ct
- 1039 Shadow Ridge Crossing
- 505 W Washington
- 7930 Haury Rd
Your Personal Tour Guide
Ask me questions while you tour the home.