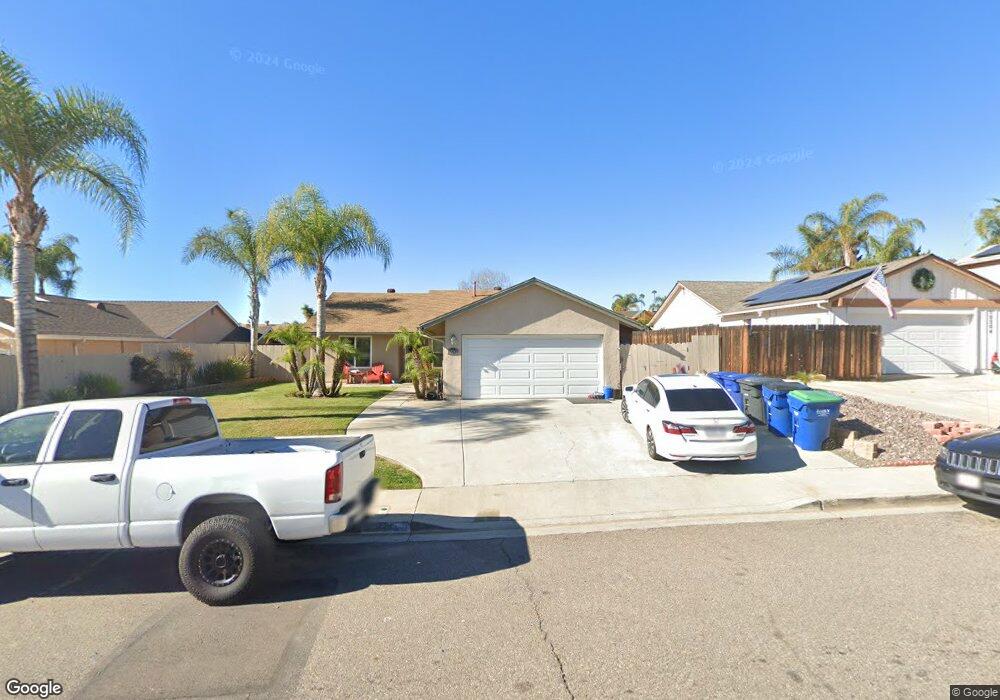
10262 Aquilla Dr Lakeside, CA 92040
Estimated Value: $802,960 - $830,000
4
Beds
2
Baths
1,372
Sq Ft
$594/Sq Ft
Est. Value
About This Home
This home is located at 10262 Aquilla Dr, Lakeside, CA 92040 and is currently estimated at $815,490, approximately $594 per square foot. 10262 Aquilla Dr is a home located in San Diego County with nearby schools including Lakeside Farms Elementary School, Lakeside Middle School, and Santana High School.
Ownership History
Date
Name
Owned For
Owner Type
Purchase Details
Closed on
Sep 8, 2010
Sold by
Bracamonte Michael and Bracamonte Linda
Bought by
Bracamonte Michael William and Bracamonte Linda Sue
Current Estimated Value
Purchase Details
Closed on
Jan 29, 2007
Sold by
Aguayo Frank A and Aguayo Cynthia L
Bought by
Bracamonte Michael and Bracamonte Linda
Purchase Details
Closed on
Jul 14, 2006
Sold by
Aguayo Frank A and Aguayo Cynthia L
Bought by
Aguayo Frank A and Aguayo Cynthia L
Purchase Details
Closed on
Nov 5, 1998
Sold by
Johnson Noah C and Johnson Shannon
Bought by
Aguayo Frank A and Aguayo Cynthia L
Home Financials for this Owner
Home Financials are based on the most recent Mortgage that was taken out on this home.
Original Mortgage
$162,439
Interest Rate
6.84%
Mortgage Type
FHA
Create a Home Valuation Report for This Property
The Home Valuation Report is an in-depth analysis detailing your home's value as well as a comparison with similar homes in the area
Purchase History
| Date | Buyer | Sale Price | Title Company |
|---|---|---|---|
| Bracamonte Michael William | -- | None Available | |
| Bracamonte Michael | $382,500 | Ticor Title Company | |
| Aguayo Frank A | -- | None Available | |
| Aguayo Frank A | $166,000 | Commonwealth Land Title Co |
Source: Public Records
Mortgage History
| Date | Status | Borrower | Loan Amount |
|---|---|---|---|
| Previous Owner | Aguayo Frank A | $162,439 |
Source: Public Records
Tax History
| Year | Tax Paid | Tax Assessment Tax Assessment Total Assessment is a certain percentage of the fair market value that is determined by local assessors to be the total taxable value of land and additions on the property. | Land | Improvement |
|---|---|---|---|---|
| 2025 | $6,152 | $512,436 | $267,940 | $244,496 |
| 2024 | $6,152 | $502,389 | $262,687 | $239,702 |
| 2023 | $5,936 | $492,539 | $257,537 | $235,002 |
| 2022 | $5,845 | $482,883 | $252,488 | $230,395 |
| 2021 | $5,762 | $473,416 | $247,538 | $225,878 |
| 2020 | $5,698 | $468,562 | $245,000 | $223,562 |
| 2019 | $5,597 | $459,376 | $240,197 | $219,179 |
| 2018 | $5,532 | $450,370 | $235,488 | $214,882 |
| 2017 | $820 | $430,000 | $194,000 | $236,000 |
| 2016 | $4,911 | $400,000 | $181,000 | $219,000 |
| 2015 | $4,711 | $380,000 | $172,000 | $208,000 |
| 2014 | $4,327 | $360,000 | $163,000 | $197,000 |
Source: Public Records
Map
Nearby Homes
- 10252 Santana St
- 10811 Susie Place
- 9948 Kincaid St
- 10520 El Nopal
- 10252 Riverhill Ln
- 10945 Grand Fork Dr
- 11320 El Nopal Unit 5619
- 11034 Brookfield Ct
- 10009 Santana Ranch Ln
- 11436 El Nopal
- 11457 El Nopal
- 9941 Woodpark Dr
- 10382 Alphonse St Unit F4
- 10660 Braverman Dr
- 10143 Maple Tree Rd
- 10671 Braverman Dr
- 10760 N Magnolia Ave Unit B6
- 10746 N Magnolia Ave Unit C3
- 10664 Cobble Ct
- 10158 Carefree Dr
- 10304 Aquilla Dr
- 10256 Aquilla Dr
- 10267 Santana St
- 10309 Santana St
- 10261 Santana St
- 10310 Aquilla Dr
- 10250 Aquilla Dr
- 10259 Santana St
- 10903 Magna Ln
- 10317 Santana St
- 10305 Aquilla Dr
- 10253 Santana St
- 10316 Aquilla Dr
- 10244 Aquilla Dr
- 10311 Aquilla Dr
- 10909 Magna Ln
- 10325 Santana St
- 10902 El Nopal
- 10245 Santana St
- 10317 Aquilla Dr
Your Personal Tour Guide
Ask me questions while you tour the home.