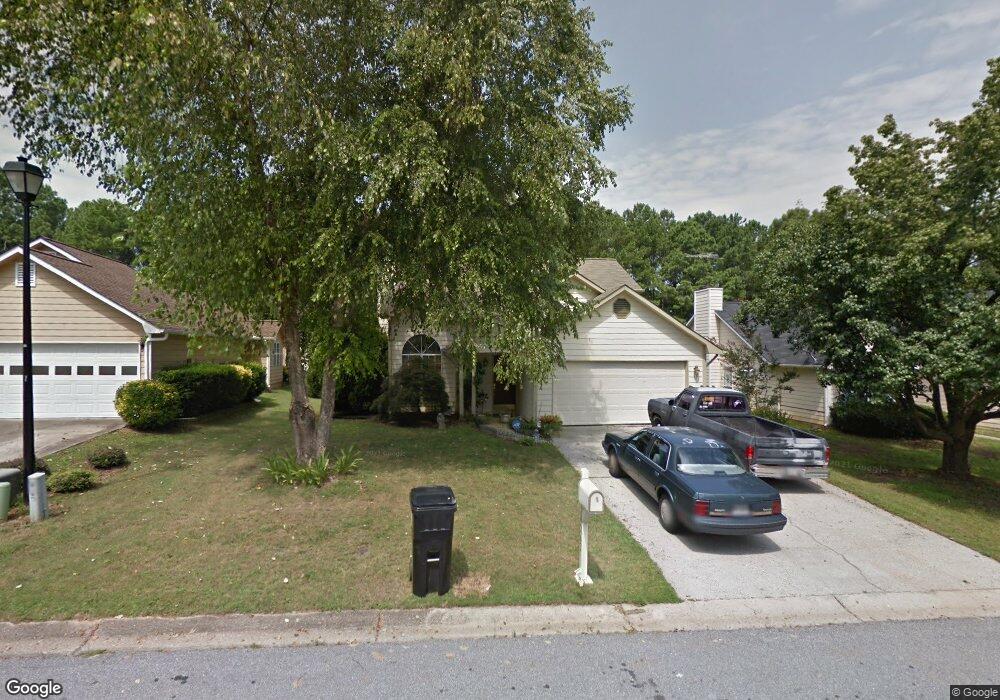
10263 Misty Ridge Dr Unit 1/75 Jonesboro, GA 30238
Estimated Value: $223,000 - $233,000
3
Beds
3
Baths
1,316
Sq Ft
$173/Sq Ft
Est. Value
About This Home
This home is located at 10263 Misty Ridge Dr Unit 1/75, Jonesboro, GA 30238 and is currently estimated at $227,260, approximately $172 per square foot. 10263 Misty Ridge Dr Unit 1/75 is a home located in Clayton County with nearby schools including Hawthorne Elementary School, Mundys Mill Middle School, and Lovejoy High School.
Ownership History
Date
Name
Owned For
Owner Type
Purchase Details
Closed on
Feb 17, 2017
Sold by
Adams Carla A
Bought by
Drake Carol D
Current Estimated Value
Home Financials for this Owner
Home Financials are based on the most recent Mortgage that was taken out on this home.
Original Mortgage
$88,349
Outstanding Balance
$72,900
Interest Rate
4.25%
Mortgage Type
FHA
Estimated Equity
$154,360
Purchase Details
Closed on
Jun 26, 2001
Sold by
Gober Charles Kk and Gober Carla S
Bought by
Gober Charles and Gober Carla A
Home Financials for this Owner
Home Financials are based on the most recent Mortgage that was taken out on this home.
Original Mortgage
$78,750
Interest Rate
7.16%
Mortgage Type
New Conventional
Purchase Details
Closed on
May 28, 1993
Sold by
Secretary Of Hud
Bought by
Gober Charles K Carla S
Create a Home Valuation Report for This Property
The Home Valuation Report is an in-depth analysis detailing your home's value as well as a comparison with similar homes in the area
Home Values in the Area
Average Home Value in this Area
Purchase History
| Date | Buyer | Sale Price | Title Company |
|---|---|---|---|
| Drake Carol D | $90,000 | -- | |
| Gober Charles | -- | -- | |
| Gober Charles K Carla S | -- | -- |
Source: Public Records
Mortgage History
| Date | Status | Borrower | Loan Amount |
|---|---|---|---|
| Open | Drake Carol D | $88,349 | |
| Closed | Drake Carol D | $5,000 | |
| Previous Owner | Gober Charles | $78,750 |
Source: Public Records
Tax History Compared to Growth
Tax History
| Year | Tax Paid | Tax Assessment Tax Assessment Total Assessment is a certain percentage of the fair market value that is determined by local assessors to be the total taxable value of land and additions on the property. | Land | Improvement |
|---|---|---|---|---|
| 2024 | $2,444 | $85,480 | $7,200 | $78,280 |
| 2023 | $2,682 | $74,280 | $7,200 | $67,080 |
| 2022 | $1,606 | $50,920 | $7,200 | $43,720 |
| 2021 | $1,460 | $46,960 | $7,200 | $39,760 |
| 2020 | $1,442 | $46,066 | $7,200 | $38,866 |
| 2019 | $1,245 | $40,665 | $6,400 | $34,265 |
| 2018 | $1,265 | $31,152 | $6,400 | $24,752 |
| 2017 | $1,121 | $27,561 | $6,400 | $21,161 |
| 2016 | $1,131 | $27,807 | $6,400 | $21,407 |
| 2015 | $1,122 | $0 | $0 | $0 |
| 2014 | $808 | $20,310 | $6,400 | $13,910 |
Source: Public Records
Map
Nearby Homes
- 1241 Larkwood Dr
- 10197 Hamilton Glen
- 10200 Commons Crossing Unit 1
- 1147 Dunivin Dr
- 1091 Commons Ct Unit 2
- 1159 Bonita Way Unit 10
- 1224 Bonita Cir
- 1253 Todiway Ct
- 10410 Iron Gate Ln
- 1036 Walnut Creek Ln
- 1352 Labelle St
- 1342 Winslow Dr
- 1296 Todiway Ct
- 10283 Richfield Ct
- 10085 Brass Ring Rd
- 10248 Briarbay Loop
- 10065 Brass Ring Rd
- 1172 Faulkner Way
- 1485 Bola Ct
- 10617 Barberry Dr
- 10263 Misty Ridge Dr
- 10269 Misty Ridge Dr Unit 1
- 10257 Misty Ridge Dr Unit 1
- 10275 Misty Ridge Dr
- 0 Misty Ridge Dr Unit 7422045
- 0 Misty Ridge Dr Unit 7486225
- 10241 Misty
- 10241 Misty Ridge Dr
- 10241 Misty Ridge Dr Unit 78
- 10281 Misty Ridge Dr
- 10264 Misty Ridge Dr
- 10258 Misty Ridge Dr
- 10270 Misty Ridge Dr
- 10270 Misty Ridge Dr Unit 1
- 10270 Misty Ridge Dr Unit 1/64
- 1223 Avery Dr
- 10287 Misty Ridge Dr
- 10265 Fairhaven Rd
- 10287 Misty Ridge Dr
- 10276 Misty Ridge Dr