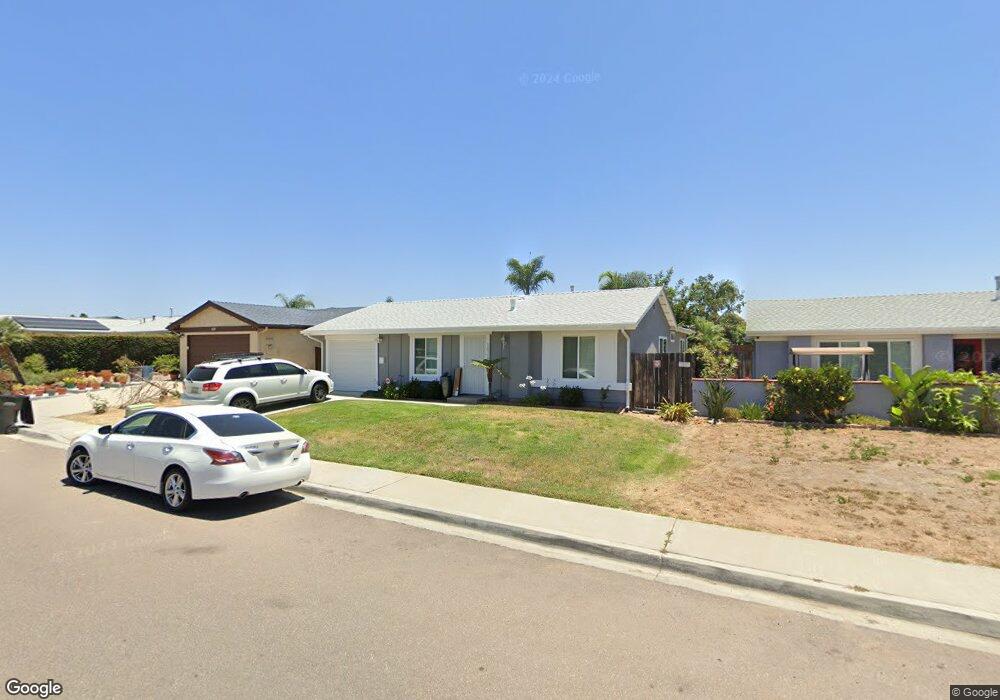
10263 Royal Ann Ave San Diego, CA 92126
Mira Mesa NeighborhoodEstimated Value: $885,000 - $1,131,000
3
Beds
2
Baths
1,044
Sq Ft
$989/Sq Ft
Est. Value
About This Home
This home is located at 10263 Royal Ann Ave, San Diego, CA 92126 and is currently estimated at $1,032,890, approximately $989 per square foot. 10263 Royal Ann Ave is a home located in San Diego County with nearby schools including Jonas Salk Elementary School, Challenger Middle School, and Mira Mesa High School.
Ownership History
Date
Name
Owned For
Owner Type
Purchase Details
Closed on
Jun 19, 2013
Sold by
Courkamp Lisa Marie and Louaillier Lisa M
Bought by
Kirkpatrick Russell Joseph and Kirkpatrick Carmen Isabel
Current Estimated Value
Home Financials for this Owner
Home Financials are based on the most recent Mortgage that was taken out on this home.
Original Mortgage
$408,500
Outstanding Balance
$294,432
Interest Rate
3.79%
Mortgage Type
New Conventional
Estimated Equity
$738,458
Purchase Details
Closed on
Nov 13, 2001
Sold by
Clopine Alan R and Clopine Anne B
Bought by
Louaillier Lisa Marie
Home Financials for this Owner
Home Financials are based on the most recent Mortgage that was taken out on this home.
Original Mortgage
$186,000
Interest Rate
6.39%
Purchase Details
Closed on
Dec 31, 1986
Create a Home Valuation Report for This Property
The Home Valuation Report is an in-depth analysis detailing your home's value as well as a comparison with similar homes in the area
Home Values in the Area
Average Home Value in this Area
Purchase History
| Date | Buyer | Sale Price | Title Company |
|---|---|---|---|
| Kirkpatrick Russell Joseph | $430,000 | Chicago Title Company | |
| Louaillier Lisa Marie | $233,000 | Commonwealth Land Title Co | |
| -- | $109,000 | -- |
Source: Public Records
Mortgage History
| Date | Status | Borrower | Loan Amount |
|---|---|---|---|
| Open | Kirkpatrick Russell Joseph | $408,500 | |
| Previous Owner | Louaillier Lisa Marie | $186,000 |
Source: Public Records
Tax History Compared to Growth
Tax History
| Year | Tax Paid | Tax Assessment Tax Assessment Total Assessment is a certain percentage of the fair market value that is determined by local assessors to be the total taxable value of land and additions on the property. | Land | Improvement |
|---|---|---|---|---|
| 2025 | $7,514 | $626,862 | $337,107 | $289,755 |
| 2024 | $7,514 | $614,572 | $330,498 | $284,074 |
| 2023 | $7,346 | $496,709 | $317,665 | $179,044 |
| 2022 | $6,005 | $496,709 | $317,665 | $179,044 |
| 2021 | $5,962 | $486,971 | $311,437 | $175,534 |
| 2020 | $5,889 | $481,979 | $308,244 | $173,735 |
| 2019 | $5,782 | $472,529 | $302,200 | $170,329 |
| 2018 | $5,406 | $463,265 | $296,275 | $166,990 |
| 2017 | $5,272 | $454,182 | $290,466 | $163,716 |
| 2016 | $5,186 | $445,277 | $284,771 | $160,506 |
| 2015 | $5,109 | $438,590 | $280,494 | $158,096 |
| 2014 | $5,028 | $430,000 | $275,000 | $155,000 |
Source: Public Records
Map
Nearby Homes
- 7971 Jade Coast Rd
- 8014 Hemphill Dr
- 10174 Camino Ruiz Unit 46
- 10166 Camino Ruiz Unit 32
- 7942 & 7944 Calico St
- 7857 Embry Point
- 10265 Eagle Rock Ave
- 14331 Montano Way
- 14633 Dunleer Way
- 14659 Dunleer Way
- 14641 Dunleer Way
- 14341 Montano Way
- 10668 Dabney Dr Unit 122
- 10668 Dabney Dr Unit 125
- 10692 Dabney Dr Unit 102
- 8177 Rose Quartz Cir
- Plan 5 at Meadows District at 3Roots - Atwood
- Plan 2 at Meadows District at 3Roots - Atwood
- Plan 1 at Meadows District at 3Roots - Atwood
- Plan 3 at Meadows District at 3Roots - Atwood
- 10269 Royal Ann Ave
- 10255 Royal Ann Ave
- 10264 Empress Ave
- 10275 Royal Ann Ave
- 10272 Empress Ave
- 10256 Empress Ave
- 10247 Royal Ann Ave
- 10278 Empress Ave
- 10248 Empress Ave
- 10264 Royal Ann Ave
- 10281 Royal Ann Ave
- 10256 Royal Ann Ave
- 10272 Royal Ann Ave
- 10284 Empress Ave
- 10278 Royal Ann Ave
- 10248 Royal Ann Ave
- 10287 Royal Ann Ave
- 10284 Royal Ann Ave
- 10233 Royal Ann Ave
- 10290 Empress Ave