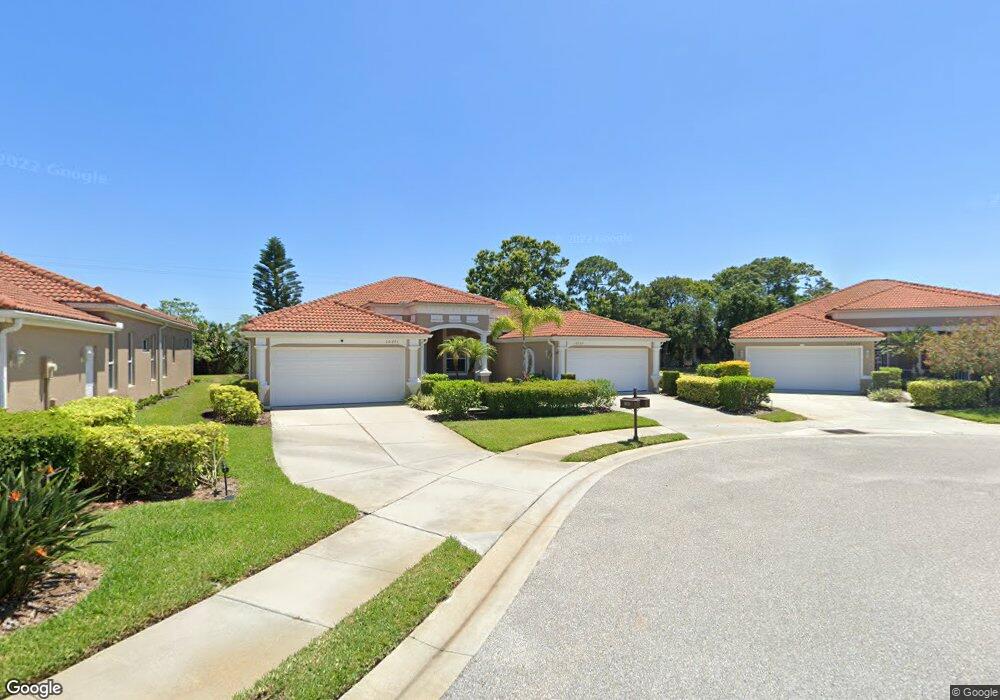
10265 Hebblewhite Ct Unit Lot16 Englewood, FL 34223
Boca Royale NeighborhoodEstimated Value: $246,000 - $317,000
3
Beds
2
Baths
1,559
Sq Ft
$180/Sq Ft
Est. Value
About This Home
This home is located at 10265 Hebblewhite Ct Unit Lot16, Englewood, FL 34223 and is currently estimated at $280,666, approximately $180 per square foot. 10265 Hebblewhite Ct Unit Lot16 is a home located in Sarasota County with nearby schools including Englewood Elementary School, L.A. Ainger Middle School, and Lemon Bay High School.
Ownership History
Date
Name
Owned For
Owner Type
Purchase Details
Closed on
Mar 9, 2020
Sold by
Krul Petrus J A and Aggenbach Tonny J
Bought by
Bykowski Roger H and Bykowski Elizabeth M
Current Estimated Value
Home Financials for this Owner
Home Financials are based on the most recent Mortgage that was taken out on this home.
Original Mortgage
$225,625
Outstanding Balance
$199,823
Interest Rate
3.5%
Mortgage Type
New Conventional
Estimated Equity
$80,843
Purchase Details
Closed on
Mar 21, 2016
Sold by
Krul Petrus J A and Krul Petrus Josephus Antoni
Bought by
Krul Petrus J A and Aggenbach Tonny J L M
Purchase Details
Closed on
Jun 19, 2009
Sold by
J-11 Properties Llc
Bought by
Krul Petrus Josephus Antoni
Purchase Details
Closed on
Mar 17, 2009
Sold by
Fifth Third Bank
Bought by
J-11 Properties Llc
Create a Home Valuation Report for This Property
The Home Valuation Report is an in-depth analysis detailing your home's value as well as a comparison with similar homes in the area
Home Values in the Area
Average Home Value in this Area
Purchase History
| Date | Buyer | Sale Price | Title Company |
|---|---|---|---|
| Bykowski Roger H | $237,500 | Amrock | |
| Krul Petrus J A | -- | Attorney | |
| Krul Petrus Josephus Antoni | $160,000 | Sunbelt Title Agency | |
| J-11 Properties Llc | $2,450,000 | Attorney |
Source: Public Records
Mortgage History
| Date | Status | Borrower | Loan Amount |
|---|---|---|---|
| Open | Bykowski Roger H | $225,625 |
Source: Public Records
Tax History Compared to Growth
Tax History
| Year | Tax Paid | Tax Assessment Tax Assessment Total Assessment is a certain percentage of the fair market value that is determined by local assessors to be the total taxable value of land and additions on the property. | Land | Improvement |
|---|---|---|---|---|
| 2024 | $3,889 | $277,100 | $62,900 | $214,200 |
| 2023 | $3,889 | $316,300 | $74,300 | $242,000 |
| 2022 | $3,446 | $266,700 | $62,700 | $204,000 |
| 2021 | $3,017 | $208,700 | $46,900 | $161,800 |
| 2020 | $2,932 | $199,200 | $47,100 | $152,100 |
| 2019 | $2,745 | $188,200 | $47,100 | $141,100 |
| 2018 | $2,633 | $181,700 | $47,400 | $134,300 |
| 2017 | $2,587 | $175,400 | $31,500 | $143,900 |
| 2016 | $2,494 | $165,200 | $27,600 | $137,600 |
| 2015 | $2,402 | $156,400 | $26,000 | $130,400 |
| 2014 | $2,342 | $125,290 | $0 | $0 |
Source: Public Records
Map
Nearby Homes
- 1800 Englewood Rd Unit 137
- 1800 Englewood Rd
- 1800 Englewood Rd Unit 123
- 1800 Englewood Rd Unit 155
- 1800 Englewood Rd Unit 164
- 1800 Englewood Rd Unit 24
- 20 N Flora Vista St
- 37 Waterford Dr
- 7 N Esplanade St
- 44 N Esplanade St
- 44 Waterford Dr
- 4 N Flora Vista St
- 3 N de Las Palmas St
- 4 S Marina Plaza Unit 237
- Ocean Front Plan at Boca Royale - Cove
- Sea Star Plan at Boca Royale - Cove
- Meadow Brook Plan at Boca Royale - Cove
- Eventide 4 Plan at Boca Royale - Cove
- Sandcastle 2 Plan at Boca Royale - Coral Villa
- Tidewinds 2 Plan at Boca Royale - Coral Villa
- 10265 Hebblewhite Ct
- 10271 Hebblewhite Ct Unit Lot17
- 10271 Hebblewhite Ct
- 10259 Hebblewhite Ct Unit Lot15
- 10259 Hebblewhite Ct
- 10301 Hebblewhite Ct Unit Lot18
- 10301 Hebblewhite Ct
- 10253 Hebblewhite Ct Unit Lot14
- 10253 Hebblewhite Ct
- 10307 Hebblewhite Ct
- 27 N Flora Vista St Unit 12
- 10247 Hebblewhite Ct Unit Lot13
- 10247 Hebblewhite Ct
- 25 N Flora Vista St
- 25 N Flora Vista St Unit 13
- 29 N Flora Vista St
- 10313 Hebblewhite Ct
- 10241 Hebblewhite Ct Unit Lot12
- 10241 Hebblewhite Ct
- 31 N Flora Vista St