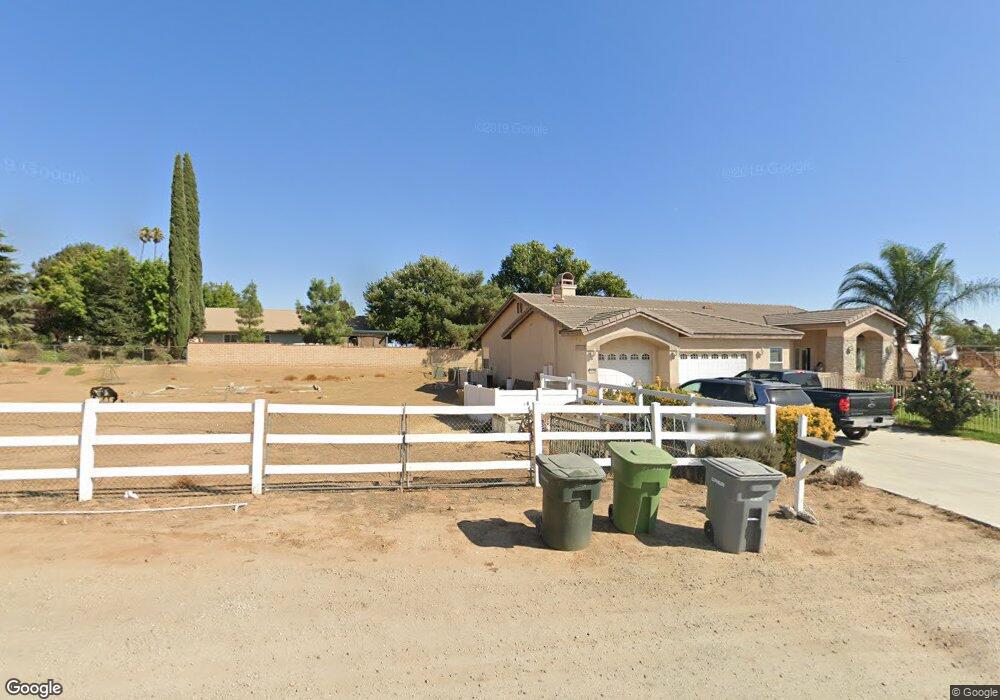
10266 Vinewood Cir Cherry Valley, CA 92223
Estimated Value: $695,000 - $1,096,000
4
Beds
3
Baths
2,588
Sq Ft
$327/Sq Ft
Est. Value
About This Home
This home is located at 10266 Vinewood Cir, Cherry Valley, CA 92223 and is currently estimated at $847,066, approximately $327 per square foot. 10266 Vinewood Cir is a home located in Riverside County with nearby schools including Brookside Elementary School, Mountain View Middle School, and Beaumont Senior High School.
Ownership History
Date
Name
Owned For
Owner Type
Purchase Details
Closed on
Feb 28, 2013
Sold by
Lantis Herald R and Lantis Karen D
Bought by
Newport Trevis W and Newport Ginger S
Current Estimated Value
Home Financials for this Owner
Home Financials are based on the most recent Mortgage that was taken out on this home.
Original Mortgage
$333,841
Outstanding Balance
$234,834
Interest Rate
3.47%
Mortgage Type
FHA
Estimated Equity
$612,232
Purchase Details
Closed on
Dec 9, 2008
Sold by
Kimmich Rudolf C
Bought by
Lantis Herald R and Lantis Karen D
Purchase Details
Closed on
Jan 4, 2008
Sold by
Parker Matt
Bought by
Kimmich Gorden
Purchase Details
Closed on
May 25, 2007
Sold by
Lantis Richard and Lantis Deanna
Bought by
Lantis Herald R and Lantis Karen D
Purchase Details
Closed on
Mar 17, 2006
Sold by
The Richard & Deanna Lantis Family Trust and Lantis Herald R
Bought by
Parker Matt
Create a Home Valuation Report for This Property
The Home Valuation Report is an in-depth analysis detailing your home's value as well as a comparison with similar homes in the area
Home Values in the Area
Average Home Value in this Area
Purchase History
| Date | Buyer | Sale Price | Title Company |
|---|---|---|---|
| Newport Trevis W | $340,000 | Chicago Title Inland Empire | |
| Lantis Herald R | $445,000 | Orange Coast Title Co | |
| Kimmich Gorden | $100,000 | Orange Coast Title | |
| Lantis Herald R | $87,500 | Commonwealth | |
| Parker Matt | $185,000 | None Available |
Source: Public Records
Mortgage History
| Date | Status | Borrower | Loan Amount |
|---|---|---|---|
| Open | Newport Trevis W | $333,841 |
Source: Public Records
Tax History Compared to Growth
Tax History
| Year | Tax Paid | Tax Assessment Tax Assessment Total Assessment is a certain percentage of the fair market value that is determined by local assessors to be the total taxable value of land and additions on the property. | Land | Improvement |
|---|---|---|---|---|
| 2025 | $6,298 | $490,197 | $123,136 | $367,061 |
| 2023 | $6,298 | $471,163 | $118,355 | $352,808 |
| 2022 | $6,201 | $461,926 | $116,035 | $345,891 |
| 2021 | $5,204 | $386,791 | $113,760 | $273,031 |
| 2020 | $5,152 | $382,826 | $112,594 | $270,232 |
| 2019 | $5,071 | $375,321 | $110,387 | $264,934 |
| 2018 | $5,052 | $367,963 | $108,224 | $259,739 |
| 2017 | $4,974 | $360,749 | $106,102 | $254,647 |
| 2016 | $4,844 | $353,676 | $104,022 | $249,654 |
| 2015 | $4,763 | $348,365 | $102,460 | $245,905 |
| 2014 | $4,767 | $341,543 | $100,454 | $241,089 |
Source: Public Records
Map
Nearby Homes
- 10265 Nancy Ave
- 38011 Vineland St
- 10132 Taylor Dr
- 9870 Nancy Ave
- 0 Golden Valley Ln
- 38570 Pass View Dr
- 832 Annandale Rd
- 1794 N Forest Oaks Dr
- 805 Annandale Rd
- 39060 Cherry Valley Blvd Unit 65
- 37492 Cherry Valley Blvd
- 1779 Sarazen St
- 1756 Sarazen St
- 10007 Beaumont Ave
- 1710 N Forest Oaks Dr
- 1700 Sarazen St
- 1744 S Forest Oaks Dr
- 1664 Landmark Way
- 1791 Hannon Rd
- 1634 Scottsdale Rd
- 10266 Vinewood Cir
- 38333 Vineland St
- 10265 Vinewood Cir
- 10318 Vinewood Cir
- 10307 Vinewood Cir
- 38298 Vineland St
- 38365 Vineland St
- 10372 Vinewood Cir
- 38300 Vineland St
- 38375 Vineland St
- 10140 Utica Way
- 38410 Vineland St
- 38250 Vineland St
- 38401 Vineland St
- 38249 Vineland St
- 0 Kehl Canyon Rd
- 38390 Vineland St
- 38455 Vineland St
- 38198 Vineland St
- 10130 Utica Way