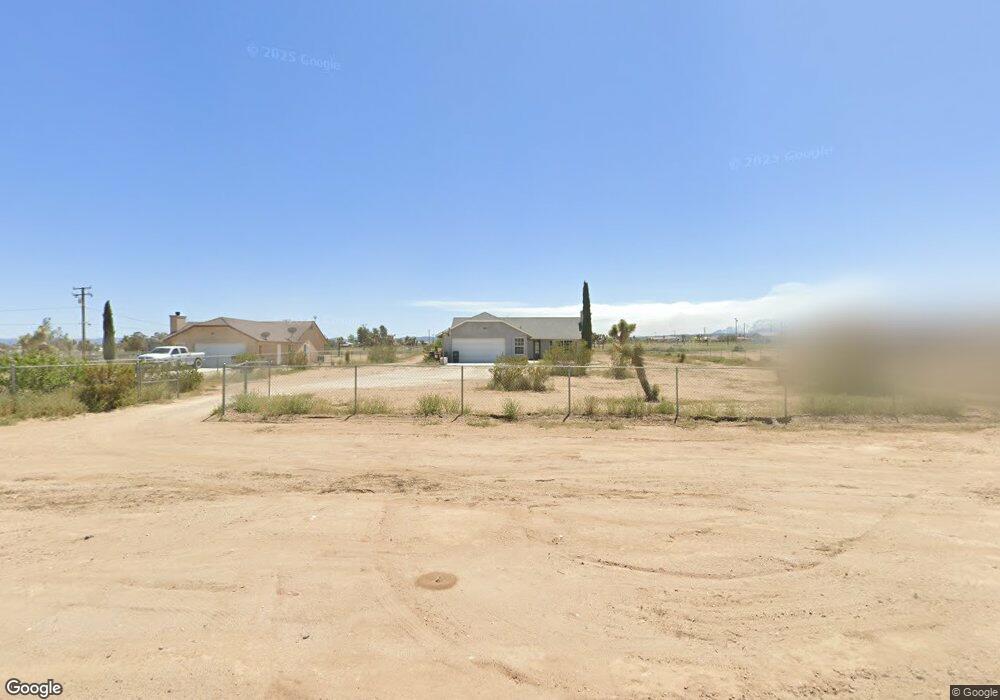
10269 Appleton St Phelan, CA 92371
Estimated Value: $365,000 - $466,000
4
Beds
2
Baths
1,466
Sq Ft
$273/Sq Ft
Est. Value
About This Home
This home is located at 10269 Appleton St, Phelan, CA 92371 and is currently estimated at $399,611, approximately $272 per square foot. 10269 Appleton St is a home with nearby schools including Baldy Mesa Elementary School, Quail Valley Middle School, and Serrano High School.
Ownership History
Date
Name
Owned For
Owner Type
Purchase Details
Closed on
Jan 27, 2011
Sold by
Fidelity Properties Inc
Bought by
Smith Scott F and Smith Marilynn V
Current Estimated Value
Create a Home Valuation Report for This Property
The Home Valuation Report is an in-depth analysis detailing your home's value as well as a comparison with similar homes in the area
Home Values in the Area
Average Home Value in this Area
Purchase History
| Date | Buyer | Sale Price | Title Company |
|---|---|---|---|
| Smith Scott F | $22,000 | Chicago Title Company |
Source: Public Records
Tax History
| Year | Tax Paid | Tax Assessment Tax Assessment Total Assessment is a certain percentage of the fair market value that is determined by local assessors to be the total taxable value of land and additions on the property. | Land | Improvement |
|---|---|---|---|---|
| 2025 | $2,371 | $182,116 | $28,186 | $153,930 |
| 2024 | $2,225 | $178,545 | $27,633 | $150,912 |
| 2023 | $2,199 | $175,044 | $27,091 | $147,953 |
| 2022 | $2,148 | $171,612 | $26,560 | $145,052 |
| 2021 | $2,109 | $168,247 | $26,039 | $142,208 |
| 2020 | $2,082 | $166,522 | $25,772 | $140,750 |
| 2019 | $2,044 | $163,257 | $25,267 | $137,990 |
| 2018 | $1,851 | $160,056 | $24,772 | $135,284 |
| 2017 | $1,820 | $156,917 | $24,286 | $132,631 |
| 2016 | $1,782 | $153,840 | $23,810 | $130,030 |
| 2015 | $1,762 | $151,529 | $23,452 | $128,077 |
| 2014 | $1,733 | $148,561 | $22,993 | $125,568 |
Source: Public Records
Map
Nearby Homes
- 0 Barker Rd
- 10444 Mono Rd
- 0 Braceo St
- 10439 Mesa St
- 9888 Solano Rd
- 9890 Solano Rd
- 10783 Goss Rd
- 11106 Baldy Mesa Rd
- 10834 Mono Rd
- 0 Salem Rd Unit PV25108956
- Sunset Lilac Rd
- 0 Mesa St Unit HD26044402
- 10276 Aster Rd
- 9628 7th St
- 11161 Mesa St
- 0 4th St
- 10626 Beaver Ave
- 0 Baldy Mesa Rd Unit 23008624
- 0 Kittering Rd
- 10375 Lilac Rd
- 10275 Appleton St
- 10255 Appleton St
- 10221 Appleton St
- 10280 Appleton St
- 11221 Joshua Rd
- 10210 Appleton St
- 11113 Joshua Rd
- 11213 Joshua Rd
- 0 Appleton St Unit IG25170576
- 0 Appleton St Unit CRCV24054676
- 0 Appleton St Unit CV24054676
- 0 Appleton St Unit 347642
- 0 Appleton St Unit 343889
- 0 Appleton St Unit 343894
- 0 Appleton St Unit 371597
- 0 Appleton St Unit 371596
- 0 Appleton St Unit 343892
- 0 Appleton St Unit 343893
- 0 Appleton St Unit 388425
- 0 Appleton St Unit 371599
Your Personal Tour Guide
Ask me questions while you tour the home.