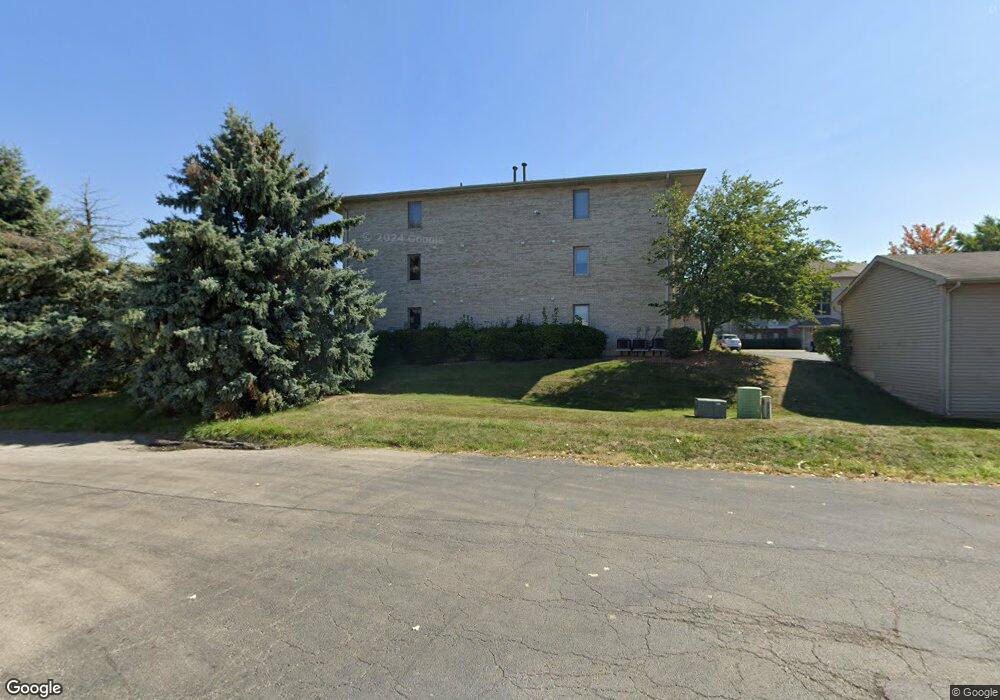
1027 Ashley Ct S Unit S1D Lockport, IL 60441
Estimated Value: $211,639 - $239,000
Studio
--
Bath
--
Sq Ft
38,159
Sq Ft Lot
About This Home
This home is located at 1027 Ashley Ct S Unit S1D, Lockport, IL 60441 and is currently estimated at $228,410. 1027 Ashley Ct S Unit S1D is a home located in Will County with nearby schools including Milne Grove Elementary School, Kelvin Grove Jr High School, and Lockport Township High School East.
Ownership History
Date
Name
Owned For
Owner Type
Purchase Details
Closed on
May 11, 2015
Sold by
Ziemke Daryl C and Ziemke Melinda
Bought by
Horwath Susan
Current Estimated Value
Home Financials for this Owner
Home Financials are based on the most recent Mortgage that was taken out on this home.
Original Mortgage
$67,500
Outstanding Balance
$38,676
Interest Rate
3.62%
Mortgage Type
New Conventional
Estimated Equity
$189,734
Purchase Details
Closed on
Dec 9, 2009
Sold by
Ziemke Terrill L
Bought by
Ziemke Terrill L and Ziemke Carole A
Purchase Details
Closed on
Jun 5, 2006
Sold by
Prairie Bank & Trust Co
Bought by
Ziemke Terrill L and Ziemke Daryl C
Home Financials for this Owner
Home Financials are based on the most recent Mortgage that was taken out on this home.
Original Mortgage
$118,400
Interest Rate
6.72%
Mortgage Type
Purchase Money Mortgage
Create a Home Valuation Report for This Property
The Home Valuation Report is an in-depth analysis detailing your home's value as well as a comparison with similar homes in the area
Home Values in the Area
Average Home Value in this Area
Purchase History
| Date | Buyer | Sale Price | Title Company |
|---|---|---|---|
| Horwath Susan | $115,000 | First American Title | |
| Ziemke Terrill L | -- | None Available | |
| Ziemke Terrill L | $149,000 | Chicago Title Insurance Co |
Source: Public Records
Mortgage History
| Date | Status | Borrower | Loan Amount |
|---|---|---|---|
| Open | Horwath Susan | $67,500 | |
| Previous Owner | Ziemke Terrill L | $118,400 |
Source: Public Records
Tax History
| Year | Tax Paid | Tax Assessment Tax Assessment Total Assessment is a certain percentage of the fair market value that is determined by local assessors to be the total taxable value of land and additions on the property. | Land | Improvement |
|---|---|---|---|---|
| 2024 | $4,332 | $58,452 | $9,131 | $49,321 |
| 2023 | $4,332 | $52,475 | $8,197 | $44,278 |
| 2022 | $3,909 | $48,464 | $7,571 | $40,893 |
| 2021 | $3,686 | $45,545 | $7,115 | $38,430 |
| 2020 | $3,582 | $44,047 | $6,881 | $37,166 |
| 2019 | $3,386 | $41,750 | $6,522 | $35,228 |
| 2018 | $3,312 | $40,144 | $6,271 | $33,873 |
| 2017 | $3,170 | $37,897 | $5,920 | $31,977 |
| 2016 | $3,261 | $37,987 | $5,934 | $32,053 |
| 2015 | $3,843 | $36,144 | $5,646 | $30,498 |
| 2014 | $3,843 | $35,092 | $5,482 | $29,610 |
| 2013 | $3,843 | $37,734 | $5,895 | $31,839 |
Source: Public Records
Map
Nearby Homes
- 1011 Maitland Dr
- 1017 Putnam Dr
- 1222 Will Dr
- 1423 Peachtree Ln
- 417 Thornton St
- 1501 Peachtree Ln
- 1509 Peachtree Ln
- 618 E 12th St
- 1526 Peachtree Ln
- 1319 Highland Ave
- 16736 Karen Springs Dr
- 936 Treeline Ct Unit 5B
- 118 N State St
- 1509 East St Unit ST1511
- 120 N State St
- 1505 East St
- 107 S State St
- 752 Rosanne St
- 623 S State St
- 16608 Karen Springs Dr
- 1027 Ashley Ct S Unit 2C
- 1027 Ashley Ct S Unit 3B
- 1027 Ashley Ct S Unit 3A
- 1027 Ashley Ct S Unit S1B
- 1027 Ashley Ct S Unit 1A
- 1027 Ashley Ct S Unit 2B
- 1027 Ashley Ct S Unit 2D
- 1027 Ashley Ct S Unit 2A
- 1027 Ashley Ct S Unit 3C
- 1027 Ashley Ct S Unit S1C
- 1027 Ashley Ct S Unit 3D
- 1027 Ashley Ct S Unit 1C
- 1033 Ashley Ct S Unit 3B
- 1033 Ashley Ct S
- 1033 Ashley Ct S Unit 1B
- 1033 Ashley Ct S Unit 1A
- 1033 Ashley Ct S Unit 1D
- 1033 Ashley Ct S Unit 3D
- 1033 Ashley Ct S Unit 2C
- 1033 Ashley Ct S Unit 2B
Your Personal Tour Guide
Ask me questions while you tour the home.