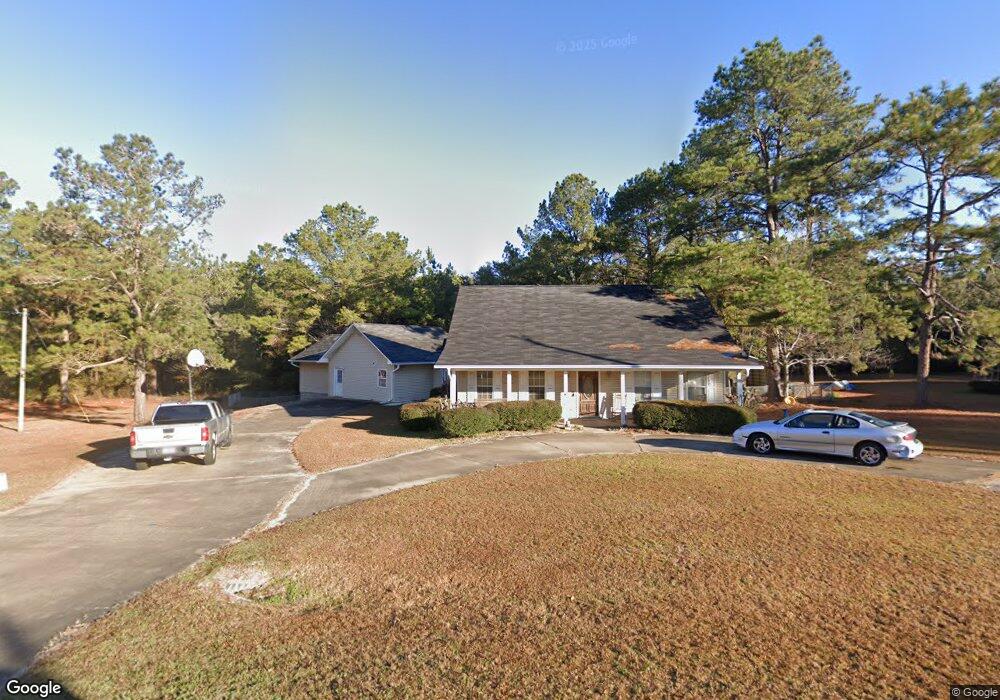
1027 E Cumberland Ct Bainbridge, GA 39817
Estimated Value: $194,000 - $291,000
Studio
1
Bath
2,487
Sq Ft
$94/Sq Ft
Est. Value
About This Home
This home is located at 1027 E Cumberland Ct, Bainbridge, GA 39817 and is currently estimated at $233,340, approximately $93 per square foot. 1027 E Cumberland Ct is a home located in Decatur County with nearby schools including Bainbridge High School, Spring Creek Charter Academy, and Grace Christian Academy.
Ownership History
Date
Name
Owned For
Owner Type
Purchase Details
Closed on
Apr 12, 2018
Sold by
Brown
Bought by
Brown Jacob
Current Estimated Value
Purchase Details
Closed on
Dec 16, 2008
Sold by
Brown Jennifer
Bought by
Brown Austin W
Purchase Details
Closed on
Mar 2, 2005
Sold by
Brown Austin W
Bought by
Brown Austin W and Brown Jennifer A
Home Financials for this Owner
Home Financials are based on the most recent Mortgage that was taken out on this home.
Original Mortgage
$132,914
Interest Rate
5.68%
Mortgage Type
FHA
Purchase Details
Closed on
Feb 11, 2005
Sold by
Young Douglas Alan
Bought by
Brown Austin W
Home Financials for this Owner
Home Financials are based on the most recent Mortgage that was taken out on this home.
Original Mortgage
$132,914
Interest Rate
5.68%
Mortgage Type
FHA
Create a Home Valuation Report for This Property
The Home Valuation Report is an in-depth analysis detailing your home's value as well as a comparison with similar homes in the area
Purchase History
| Date | Buyer | Sale Price | Title Company |
|---|---|---|---|
| Brown Jacob | -- | -- | |
| Brown Austin W | -- | -- | |
| Brown Austin W | $135,000 | -- | |
| Brown Austin W | $135,000 | -- |
Source: Public Records
Mortgage History
| Date | Status | Borrower | Loan Amount |
|---|---|---|---|
| Previous Owner | Brown Austin W | $132,914 |
Source: Public Records
Tax History
| Year | Tax Paid | Tax Assessment Tax Assessment Total Assessment is a certain percentage of the fair market value that is determined by local assessors to be the total taxable value of land and additions on the property. | Land | Improvement |
|---|---|---|---|---|
| 2025 | $2,594 | $90,208 | $4,800 | $85,408 |
| 2024 | $2,590 | $81,925 | $4,800 | $77,125 |
| 2023 | $2,582 | $81,925 | $4,800 | $77,125 |
| 2022 | $2,239 | $72,604 | $4,800 | $67,804 |
| 2021 | $2,174 | $68,647 | $4,800 | $63,847 |
| 2020 | $2,067 | $61,810 | $4,800 | $57,010 |
| 2019 | $2,072 | $59,619 | $4,800 | $54,819 |
| 2018 | $2,096 | $61,023 | $5,040 | $55,983 |
| 2017 | $2,134 | $61,023 | $5,040 | $55,983 |
| 2016 | $2,134 | $61,023 | $5,040 | $55,983 |
| 2015 | $2,194 | $61,023 | $5,040 | $55,983 |
| 2014 | $2,034 | $61,023 | $5,040 | $55,983 |
| 2013 | -- | $61,022 | $5,040 | $55,982 |
Source: Public Records
Map
Nearby Homes
- 1702 Vada Rd
- 1606 Hemlock St
- 1302 Majestic Ave
- 000 E River Rd
- 2467 Belcher Ln
- 1503 Smart St
- 150 Rivervale Dr
- Lot 7 Easy Dr
- 1204 E Water St
- 1203 E Broughton St
- 936 Cooper St
- 1020 E Water St
- 306 S Boulevard Dr
- 401 S Collier St
- 627 Planter St
- 502 Chason St
- 502 Chason St
- 0 Pine St Unit 10993
- 411 Independent St
- 703 S Boulevard Dr
- 1023 E Cumberland Ct
- 1029 E Cumberland Ct
- 1069 E Cumberland Ct
- 1019 E Cumberland Ct
- 1033 E Cumberland Ct
- 1065 E Cumberland Ct
- 1073 E Cumberland Ct
- 1037 E Cumberland Ct
- 1061 E Cumberland Ct
- 1011 E Cumberland Ct
- 2008 Yorktown
- 1077 E Cumberland Ct
- 1057 E Cumberland Ct
- 2012 Yorktown Place
- 1045 E Cumberland Ct
- 1081 E Cumberland Ct
- 1535 Richmond Ln
- 1003 E Cumberland Ct
- 1049 E Cumberland Ct
- 1053 E Cumberland Ct
Your Personal Tour Guide
Ask me questions while you tour the home.