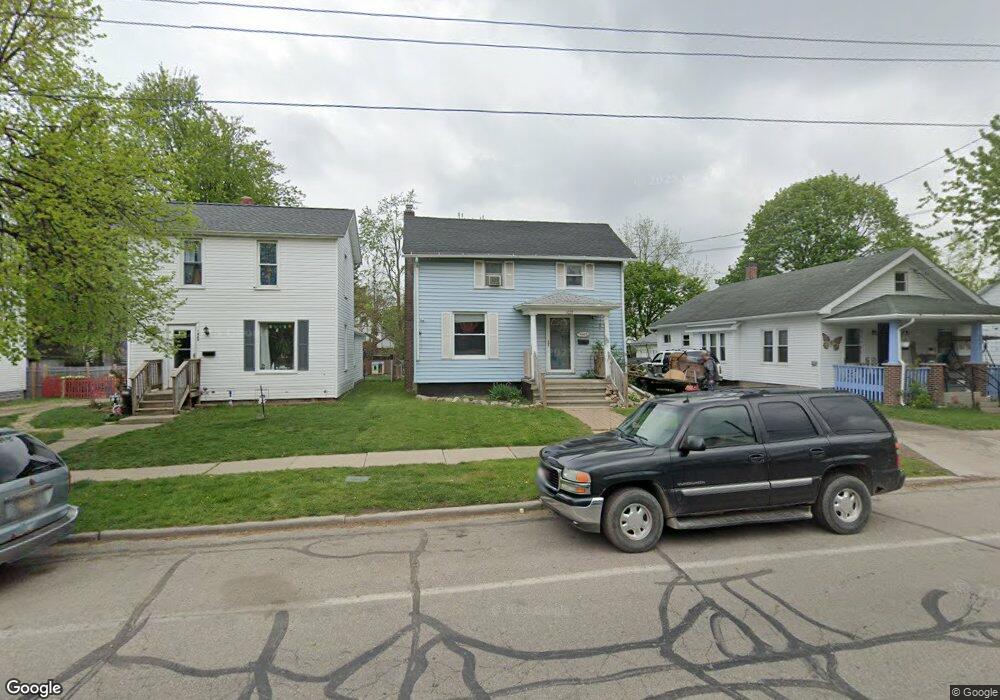
1027 E Maple Ave Adrian, MI 49221
Estimated Value: $115,165 - $123,000
4
Beds
1
Bath
1,279
Sq Ft
$94/Sq Ft
Est. Value
About This Home
This home is located at 1027 E Maple Ave, Adrian, MI 49221 and is currently estimated at $119,791, approximately $93 per square foot. 1027 E Maple Ave is a home located in Lenawee County with nearby schools including Adrian High School, St. Joseph Academy, and St. Joseph's Academy.
Ownership History
Date
Name
Owned For
Owner Type
Purchase Details
Closed on
Mar 1, 2019
Sold by
Lenawee County Of
Bought by
Crist Ryan
Current Estimated Value
Purchase Details
Closed on
Oct 12, 2018
Sold by
Crist Ryan
Bought by
Spring Brook Inv Co
Purchase Details
Closed on
May 31, 2006
Sold by
Morgan Mary J and Morgan Cameron L
Bought by
Morgan Mary J and Morgan Cameron L
Home Financials for this Owner
Home Financials are based on the most recent Mortgage that was taken out on this home.
Original Mortgage
$111,600
Interest Rate
0.99%
Mortgage Type
New Conventional
Purchase Details
Closed on
Jun 9, 2005
Sold by
Willnow Mary J
Bought by
Willnow Mary J and Morgan Cameron L
Home Financials for this Owner
Home Financials are based on the most recent Mortgage that was taken out on this home.
Original Mortgage
$96,800
Interest Rate
7.65%
Mortgage Type
Adjustable Rate Mortgage/ARM
Create a Home Valuation Report for This Property
The Home Valuation Report is an in-depth analysis detailing your home's value as well as a comparison with similar homes in the area
Home Values in the Area
Average Home Value in this Area
Purchase History
| Date | Buyer | Sale Price | Title Company |
|---|---|---|---|
| Crist Ryan | $502 | None Available | |
| Spring Brook Inv Co | $1,000 | -- | |
| Morgan Mary J | -- | Federated Land Title Agency | |
| Willnow Mary J | -- | Federated Land Title Agency |
Source: Public Records
Mortgage History
| Date | Status | Borrower | Loan Amount |
|---|---|---|---|
| Previous Owner | Morgan Mary J | $111,600 | |
| Previous Owner | Willnow Mary J | $96,800 |
Source: Public Records
Tax History
| Year | Tax Paid | Tax Assessment Tax Assessment Total Assessment is a certain percentage of the fair market value that is determined by local assessors to be the total taxable value of land and additions on the property. | Land | Improvement |
|---|---|---|---|---|
| 2025 | $2,109 | $43,400 | $0 | $0 |
| 2024 | $16 | $39,900 | $0 | $0 |
| 2023 | $2,313 | $35,700 | $0 | $0 |
| 2022 | $1,702 | $32,400 | $0 | $0 |
| 2021 | $1,672 | $30,100 | $0 | $0 |
| 2020 | $1,694 | $28,100 | $0 | $0 |
| 2019 | $75,161 | $26,300 | $0 | $0 |
| 2018 | $2,681 | $30,932 | $0 | $0 |
| 2017 | $2,531 | $27,035 | $0 | $0 |
| 2016 | $2,998 | $25,796 | $0 | $0 |
| 2014 | -- | $26,800 | $0 | $0 |
Source: Public Records
Map
Nearby Homes
- 924 Frank St
- 717 Bristol St
- 822 Elm St
- 803 Ormsby St
- 423 E Butler St
- 820 Mulberry St
- 417 E Hunt St
- 418 E Church St
- 612 N Clinton St
- 229 Clinton St
- 603 S Center St
- 625 Division St
- 322 Lawrence Ave
- 632 Division St
- 2751 Cloverdale Ave
- 228 W Church St
- 227 Jordan St
- 839 Dennis St
- 306 Summer St
- 227 Greenly St
- 1027 E Maple Ave Unit MAPLE
- 1031 E Maple Ave
- 1023 E Maple Ave
- 1035 E Maple Ave
- 1019 E Maple Ave
- 1028 E Butler St
- 1013 E Maple Ave
- 1034 E Butler St
- 1024 E Butler St
- 1043 E Maple Ave
- 1038 E Butler St
- 1018 E Butler St
- 1018 E Butler St Unit BUTLER ST
- 1018 E Butler St Unit BUTLER
- 1026 E Maple Ave
- 1032 E Maple Ave
- 1032 E Maple Ave
- 1014 E Butler St
- 1044 E Butler St
- 1020 E Maple Ave
Your Personal Tour Guide
Ask me questions while you tour the home.