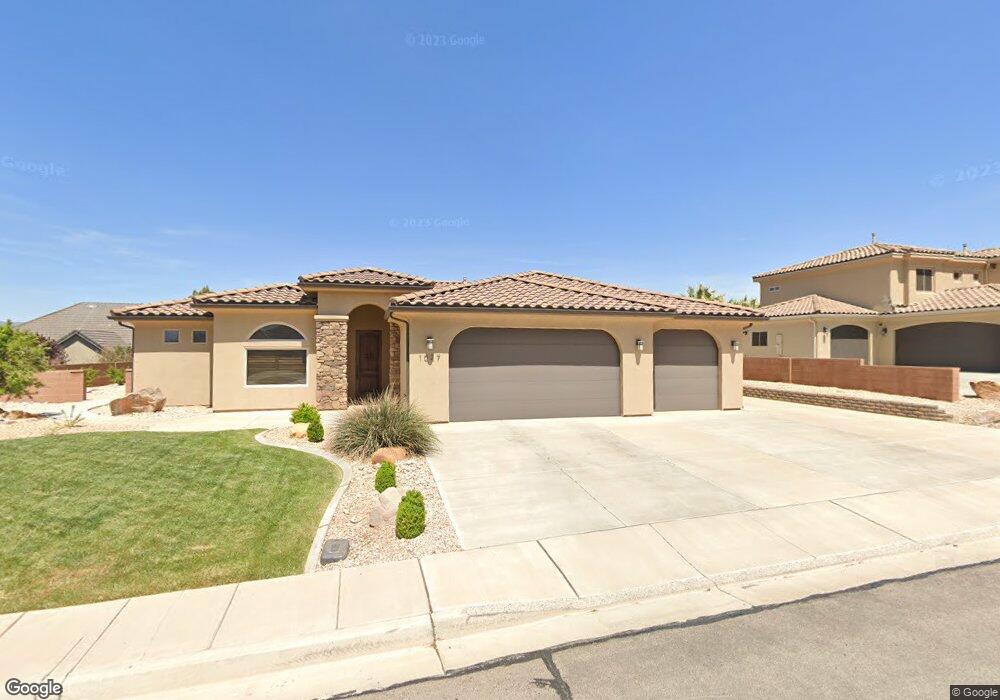
1027 E Sage Dell St Washington, UT 84780
Estimated Value: $631,665 - $702,000
4
Beds
3
Baths
2,189
Sq Ft
$299/Sq Ft
Est. Value
About This Home
This home is located at 1027 E Sage Dell St, Washington, UT 84780 and is currently estimated at $654,916, approximately $299 per square foot. 1027 E Sage Dell St is a home located in Washington County with nearby schools including Horizon School, Washington Fields Intermediate School, and Crimson Cliffs Middle School.
Ownership History
Date
Name
Owned For
Owner Type
Purchase Details
Closed on
Feb 13, 2023
Sold by
Gappmayer Robert B
Bought by
Gappmayer Family Revocable Trust
Current Estimated Value
Purchase Details
Closed on
Nov 3, 2011
Sold by
Woodkin Development Llc
Bought by
Gappmayer Robert B and Gappmayer Vicci N
Purchase Details
Closed on
May 6, 2011
Sold by
Wood Karl G and Karl G Wood Trust
Bought by
Woodkin Development Llc
Purchase Details
Closed on
Jan 10, 2008
Sold by
Woodkin Development Llc
Bought by
Wood Karl G and Karl G Wood Trust
Purchase Details
Closed on
Sep 14, 2005
Sold by
Drd Land Development Corp
Bought by
Woodkin Development L L C
Home Financials for this Owner
Home Financials are based on the most recent Mortgage that was taken out on this home.
Original Mortgage
$162,514
Interest Rate
5.72%
Mortgage Type
Purchase Money Mortgage
Create a Home Valuation Report for This Property
The Home Valuation Report is an in-depth analysis detailing your home's value as well as a comparison with similar homes in the area
Purchase History
| Date | Buyer | Sale Price | Title Company |
|---|---|---|---|
| Gappmayer Family Revocable Trust | -- | -- | |
| Gappmayer Robert B | -- | Southern Utah Title | |
| Woodkin Development Llc | -- | None Available | |
| Wood Karl G | -- | None Available | |
| Woodkin Development L L C | -- | First Title Of Utah |
Source: Public Records
Mortgage History
| Date | Status | Borrower | Loan Amount |
|---|---|---|---|
| Previous Owner | Woodkin Development L L C | $162,514 |
Source: Public Records
Tax History
| Year | Tax Paid | Tax Assessment Tax Assessment Total Assessment is a certain percentage of the fair market value that is determined by local assessors to be the total taxable value of land and additions on the property. | Land | Improvement |
|---|---|---|---|---|
| 2025 | $4,318 | $653,800 | $230,000 | $423,800 |
| 2023 | $4,306 | $646,300 | $240,000 | $406,300 |
| 2022 | $4,463 | $630,300 | $185,000 | $445,300 |
| 2021 | $3,748 | $432,900 | $115,000 | $317,900 |
| 2020 | $3,483 | $380,500 | $105,000 | $275,500 |
| 2019 | $3,374 | $360,000 | $90,000 | $270,000 |
| 2018 | $3,291 | $330,000 | $0 | $0 |
| 2017 | $2,984 | $291,100 | $0 | $0 |
| 2016 | $3,134 | $283,100 | $0 | $0 |
| 2015 | $3,124 | $271,500 | $0 | $0 |
| 2014 | $3,097 | $270,900 | $0 | $0 |
Source: Public Records
Map
Nearby Homes
- Lot 1 S Mustang St
- Lot 3 S Mustang St
- Lot 4 S Mustang St
- 2050 S Stable Cir
- 2050 S Stable Cir Unit 36
- 1628 S Camino Real
- 1229 E Black Brush Dr
- 1166 E Colt Ave
- 1279 E Libra St
- 1067 E Silver Falls Dr
- 2056 S Great Basin Dr
- 1167 E Corral Way
- 1915 S Cyclone Dr
- 1915 S Cyclone Dr Unit 254
- 720 E Meadow Ln
- 1904 S Cyclone Dr Unit 262
- 1321 E Pony Way
- 2098 S Pinto St
- 2114 S Pinto St Unit 76
- 1226 E Pony Trail
- 1049 E Sage Dell St
- 1001 E Sage Dell St
- 1018 E Sage Dell St
- 1880 S Purple Sage Dr
- 1067 E Sage Dell St
- 1022 E White Sage Dr
- 1002 E White Sage Dr
- 1044 E White Sage Dr
- 0 E Sage Dell St
- 1881 S Slippery Elm Cir
- 1063 E White Sage Dr Unit 41
- 0 S Slippery Elm Cir
- 977 E Sage Dell St
- 1058 E White Sage Dr
- 982 E White Sage Dr
- #40 White Sage Dr
- Lot 57 White Sage Dr
- 41 White Sage Dr
- 0 White Sage Dr
- Lot 41 White Sage Dr
Your Personal Tour Guide
Ask me questions while you tour the home.