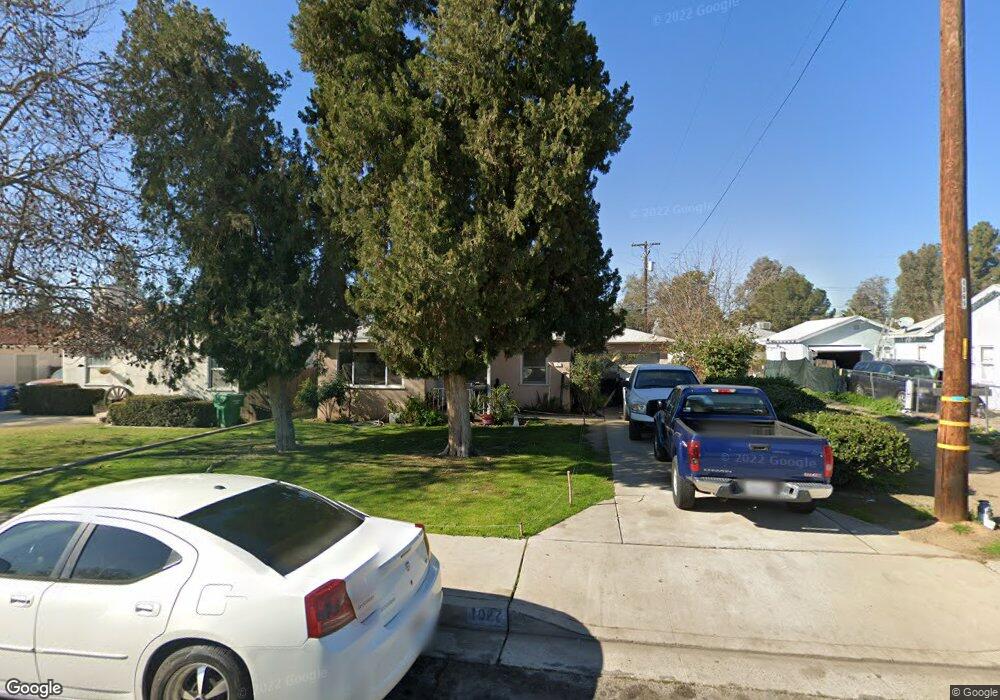
1027 Glade St Bakersfield, CA 93308
Estimated Value: $210,347 - $255,000
2
Beds
1
Bath
944
Sq Ft
$249/Sq Ft
Est. Value
About This Home
This home is located at 1027 Glade St, Bakersfield, CA 93308 and is currently estimated at $235,087, approximately $249 per square foot. 1027 Glade St is a home located in Kern County with nearby schools including Standard Elementary School, Standard Middle School, and North High School.
Ownership History
Date
Name
Owned For
Owner Type
Purchase Details
Closed on
Jul 27, 2021
Sold by
Montgomery Kim
Bought by
Montgomery Ron and Montgomery Kim
Current Estimated Value
Purchase Details
Closed on
Apr 23, 2012
Sold by
Montgomery Kim and The Glade Holding Trust
Bought by
Montgomery Kim
Purchase Details
Closed on
Nov 4, 2011
Sold by
Herron Billie G and The Glade Holding Trust
Bought by
Herron Billie G and The Glade Holding Trust
Purchase Details
Closed on
Oct 13, 1998
Sold by
Herron Welch Billie
Bought by
Glade Holding Trust
Purchase Details
Closed on
Oct 15, 1997
Sold by
Glade Holding Trust & Price John T and Billie
Bought by
Herron Welch Billie
Home Financials for this Owner
Home Financials are based on the most recent Mortgage that was taken out on this home.
Original Mortgage
$25,000
Interest Rate
7.19%
Purchase Details
Closed on
Jun 20, 1994
Sold by
Herron Billie G
Bought by
Price John T and Herron Billie G
Create a Home Valuation Report for This Property
The Home Valuation Report is an in-depth analysis detailing your home's value as well as a comparison with similar homes in the area
Purchase History
| Date | Buyer | Sale Price | Title Company |
|---|---|---|---|
| Montgomery Ron | -- | None Available | |
| Montgomery Kim | -- | None Available | |
| Herron Billie G | -- | None Available | |
| Glade Holding Trust | -- | -- | |
| Herron Welch Billie | -- | Stewart Title | |
| Herron Welch Billie | -- | Stewart Title | |
| Price John T | -- | -- |
Source: Public Records
Mortgage History
| Date | Status | Borrower | Loan Amount |
|---|---|---|---|
| Closed | Herron Welch Billie | $25,000 |
Source: Public Records
Tax History
| Year | Tax Paid | Tax Assessment Tax Assessment Total Assessment is a certain percentage of the fair market value that is determined by local assessors to be the total taxable value of land and additions on the property. | Land | Improvement |
|---|---|---|---|---|
| 2025 | $1,989 | $84,331 | $22,181 | $62,150 |
| 2024 | $1,917 | $82,679 | $21,747 | $60,932 |
| 2023 | $1,917 | $81,059 | $21,321 | $59,738 |
| 2022 | $1,837 | $79,470 | $20,903 | $58,567 |
| 2021 | $1,746 | $77,913 | $20,494 | $57,419 |
| 2020 | $1,670 | $77,115 | $20,284 | $56,831 |
| 2019 | $1,648 | $77,115 | $20,284 | $56,831 |
| 2018 | $1,589 | $74,123 | $19,498 | $54,625 |
| 2017 | $1,572 | $72,670 | $19,116 | $53,554 |
| 2016 | $1,462 | $71,246 | $18,742 | $52,504 |
| 2015 | $1,442 | $70,177 | $18,461 | $51,716 |
| 2014 | $1,413 | $68,803 | $18,100 | $50,703 |
Source: Public Records
Map
Nearby Homes
- 1100 Glade St
- 828 Iris St
- 222 Hughes Ave
- 118 Hughes Ave
- 115 Ferguson Ave
- 702 Lilac St
- 109 Hughes Ave
- 200 E Warren Ave
- 400 E Roberts Ln Unit 48
- 400 E Roberts Ln Unit 95
- 400 E Roberts Ln Unit 30
- 400 E Roberts Ln Unit 51
- 400 E Roberts Ln Unit 68
- 400 E Roberts Ln Unit 55
- 201 E Warren Ave
- 703 Wisteria St
- 713 Wisteria St
- 215 Harding Ave
- 114 E Warren Ave
- 112 Woodrow Ave
Your Personal Tour Guide
Ask me questions while you tour the home.