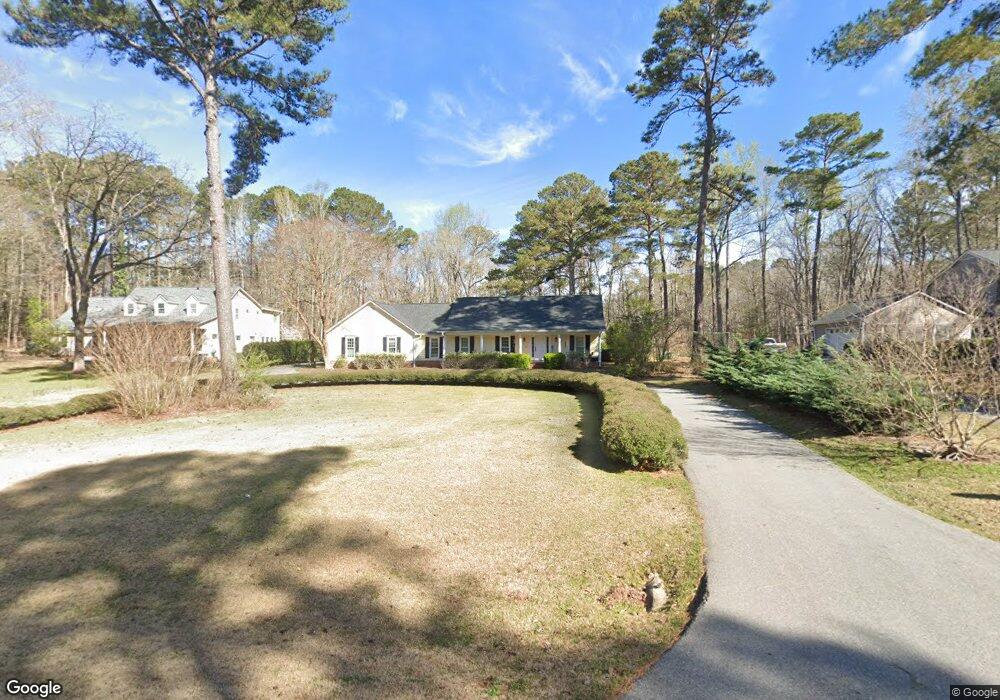
1027 Riverside Dr Lagrange, GA 30240
Estimated Value: $347,719 - $489,000
4
Beds
3
Baths
2,269
Sq Ft
$186/Sq Ft
Est. Value
About This Home
This home is located at 1027 Riverside Dr, Lagrange, GA 30240 and is currently estimated at $421,930, approximately $185 per square foot. 1027 Riverside Dr is a home located in Troup County with nearby schools including Ethel W. Kight Elementary School, Hollis Hand Elementary School, and Franklin Forest Elementary School.
Ownership History
Date
Name
Owned For
Owner Type
Purchase Details
Closed on
Dec 4, 2020
Sold by
Colson Susie G
Bought by
Dudley David and Cochran Robin A
Current Estimated Value
Home Financials for this Owner
Home Financials are based on the most recent Mortgage that was taken out on this home.
Original Mortgage
$265,500
Outstanding Balance
$235,829
Interest Rate
2.7%
Mortgage Type
New Conventional
Estimated Equity
$186,101
Purchase Details
Closed on
Jan 1, 1988
Sold by
John T Colson
Bought by
Colson John T
Purchase Details
Closed on
Oct 1, 1986
Sold by
Susie G Colson
Bought by
John T Colson
Purchase Details
Closed on
Oct 8, 1985
Sold by
Eugene George Gatwood
Bought by
Susie G Colson
Purchase Details
Closed on
Mar 11, 1983
Sold by
Daniel Reality Etal
Bought by
Eugene George Gatwood
Purchase Details
Closed on
Jan 1, 1981
Bought by
Daniel Reality Etal
Create a Home Valuation Report for This Property
The Home Valuation Report is an in-depth analysis detailing your home's value as well as a comparison with similar homes in the area
Purchase History
| Date | Buyer | Sale Price | Title Company |
|---|---|---|---|
| Dudley David | $295,000 | -- | |
| Colson John T | -- | -- | |
| John T Colson | -- | -- | |
| Susie G Colson | $23,000 | -- | |
| Eugene George Gatwood | $20,000 | -- | |
| Daniel Reality Etal | -- | -- |
Source: Public Records
Mortgage History
| Date | Status | Borrower | Loan Amount |
|---|---|---|---|
| Open | Dudley David | $265,500 |
Source: Public Records
Tax History
| Year | Tax Paid | Tax Assessment Tax Assessment Total Assessment is a certain percentage of the fair market value that is determined by local assessors to be the total taxable value of land and additions on the property. | Land | Improvement |
|---|---|---|---|---|
| 2025 | $3,975 | $145,760 | $34,000 | $111,760 |
| 2024 | $3,361 | $123,240 | $34,000 | $89,240 |
| 2023 | $3,501 | $128,360 | $34,000 | $94,360 |
| 2022 | $3,316 | $118,800 | $30,000 | $88,800 |
| 2021 | $3,085 | $102,280 | $30,000 | $72,280 |
| 2020 | $3,025 | $102,280 | $30,000 | $72,280 |
| 2019 | $2,557 | $86,760 | $20,000 | $66,760 |
| 2018 | $2,557 | $86,760 | $20,000 | $66,760 |
| 2017 | $2,557 | $86,760 | $20,000 | $66,760 |
| 2016 | $2,602 | $88,264 | $20,000 | $68,264 |
| 2015 | $2,607 | $88,264 | $20,000 | $68,264 |
| 2014 | $2,508 | $84,851 | $20,000 | $64,851 |
| 2013 | -- | $83,262 | $20,000 | $63,262 |
Source: Public Records
Map
Nearby Homes
- 4004 White Oak Ln
- 110 Thomas Dr
- 104 Dogwood Point
- 709 Vernon Ferry Rd
- 129 Angela East Dr
- 4.5 ACRES Whatley Rd N
- 0 Deming St Unit 10550189
- 0 Salem Rd Tract 2 Unit 10675187
- 213 Linda Ln
- 203 Shawnee Dr
- 103 Iroquois Dr
- 98 Hearn Rd
- 104 Spring Valley Dr
- 112 Brookwood Dr
- 117 Brookwood Dr
- 201 Willowcrest Way
- 960 Cameron Mill Rd
- 210 Pinehaven Dr
- 112 Foxdale Dr
- 1000 Foxcroft Dr
- 1029 Riverside Dr
- 1025 Riverside Dr
- 1023 Riverside Dr
- 1031 Riverside Dr
- 1026 Riverside Dr
- 1022 Riverside Dr
- 3008 White Oak Ct
- 1028 Riverside Dr
- 1037 Riverside Dr
- 3000 White Oak Ct
- 3006 White Oak Ct
- 1030 Riverside Dr
- 1020 Riverside Dr
- 1041 Riverside Dr
- 1018 Riverside Dr
- 1032 Riverside Dr
- 3001 White Oak Ct
- 3007 White Oak Ct
- 1045 Riverside Dr
- 1034 Riverside Dr
Your Personal Tour Guide
Ask me questions while you tour the home.