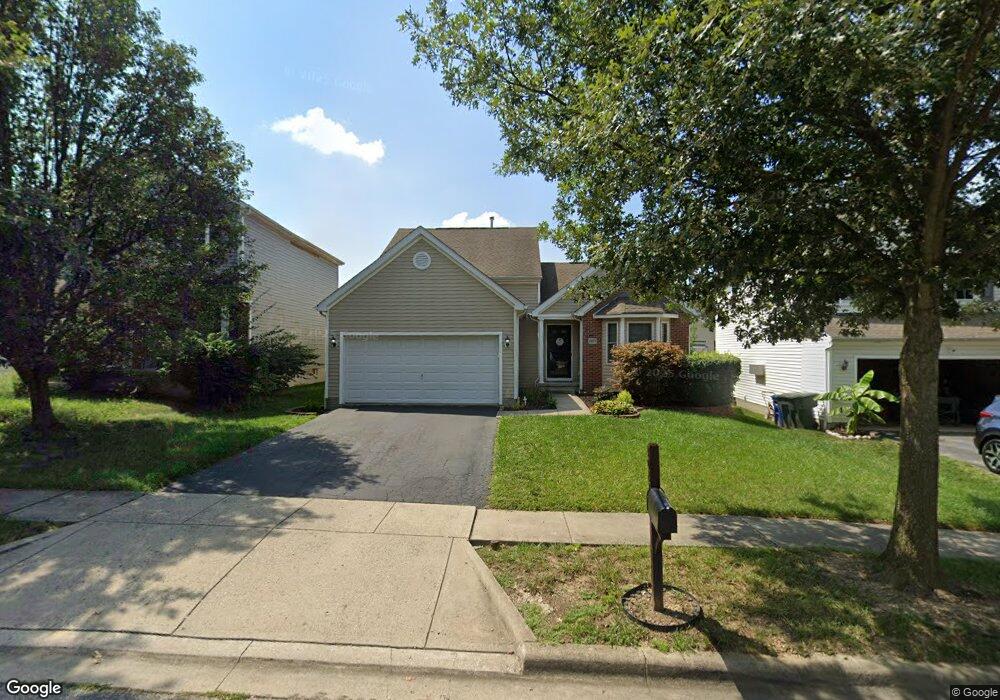
1027 Tenbrook Place Columbus, OH 43228
Georgian Heights NeighborhoodEstimated Value: $319,000 - $343,000
3
Beds
3
Baths
1,565
Sq Ft
$209/Sq Ft
Est. Value
About This Home
This home is located at 1027 Tenbrook Place, Columbus, OH 43228 and is currently estimated at $327,813, approximately $209 per square foot. 1027 Tenbrook Place is a home located in Franklin County with nearby schools including Prairie Norton Elementary School, Pleasant View Middle School, and Central Crossing High School.
Ownership History
Date
Name
Owned For
Owner Type
Purchase Details
Closed on
Oct 27, 2008
Sold by
Hsbc Mortgage Services Inc
Bought by
Mackellar Brock A
Current Estimated Value
Home Financials for this Owner
Home Financials are based on the most recent Mortgage that was taken out on this home.
Original Mortgage
$113,502
Interest Rate
6.3%
Mortgage Type
FHA
Purchase Details
Closed on
Sep 18, 2008
Sold by
Vann Charles and Case #08Cve01 1456
Bought by
Hsbc Mortgage Services Inc
Home Financials for this Owner
Home Financials are based on the most recent Mortgage that was taken out on this home.
Original Mortgage
$113,502
Interest Rate
6.3%
Mortgage Type
FHA
Purchase Details
Closed on
May 12, 2006
Sold by
Dominion Homes Inc
Bought by
Vann Charles
Home Financials for this Owner
Home Financials are based on the most recent Mortgage that was taken out on this home.
Original Mortgage
$156,875
Interest Rate
9.45%
Mortgage Type
Fannie Mae Freddie Mac
Create a Home Valuation Report for This Property
The Home Valuation Report is an in-depth analysis detailing your home's value as well as a comparison with similar homes in the area
Home Values in the Area
Average Home Value in this Area
Purchase History
| Date | Buyer | Sale Price | Title Company |
|---|---|---|---|
| Mackellar Brock A | $115,000 | Attorney | |
| Hsbc Mortgage Services Inc | $96,000 | None Available | |
| Vann Charles | $156,900 | Alliance Ti |
Source: Public Records
Mortgage History
| Date | Status | Borrower | Loan Amount |
|---|---|---|---|
| Previous Owner | Mackellar Brock A | $113,502 | |
| Previous Owner | Vann Charles | $156,875 |
Source: Public Records
Tax History Compared to Growth
Tax History
| Year | Tax Paid | Tax Assessment Tax Assessment Total Assessment is a certain percentage of the fair market value that is determined by local assessors to be the total taxable value of land and additions on the property. | Land | Improvement |
|---|---|---|---|---|
| 2024 | $3,625 | $99,410 | $23,630 | $75,780 |
| 2023 | $3,560 | $99,400 | $23,625 | $75,775 |
| 2022 | $3,060 | $62,690 | $8,400 | $54,290 |
| 2021 | $3,121 | $62,690 | $8,400 | $54,290 |
| 2020 | $3,103 | $62,690 | $8,400 | $54,290 |
| 2019 | $2,912 | $51,910 | $7,000 | $44,910 |
| 2018 | $2,823 | $51,910 | $7,000 | $44,910 |
| 2017 | $2,885 | $51,910 | $7,000 | $44,910 |
| 2016 | $2,747 | $45,400 | $9,000 | $36,400 |
| 2015 | $2,747 | $45,400 | $9,000 | $36,400 |
| 2014 | $2,749 | $45,400 | $9,000 | $36,400 |
| 2013 | $1,514 | $50,400 | $9,975 | $40,425 |
Source: Public Records
Map
Nearby Homes
- 4518 Hall Rd
- 4459 Amwood St
- 4483 White Leaf Way
- 4848 Deephollow Dr
- 829 Crevis Ln
- 4715 Sullivant Ave Unit 46
- 4789 Dolan Place
- 4201 Sexton Dr
- 4190 Salem Dr
- 4419 Hammerton Dr Unit 13D
- 4212 Sexton Dr
- 4950 Cherry Creek Pkwy S
- 1800 Georgesville Square Dr
- 4655 Parkwick Dr
- 4146 Sexton Dr
- 673 Roth Ave
- 4220 Atlanta Dr
- 4763 Hafey Ave
- 840 Cherry Bud Dr
- 4778 Hafey Ave
- 1027 Tenbrook Place Unit 38
- 1035 Tenbrook Place
- 1019 Tenbrook Place
- 1019 Tenbrook Place Unit 39
- 1011 Tenbrook Place
- 1028 Rowland Ave Unit 33
- 1043 Tenbrook Place
- 1043 Tenbrook Place Unit 36
- 1036 Rowland Ave
- 1036 Rowland Ave Unit 34
- 1020 Rowland Ave
- 1020 Rowland Ave Unit 32
- 1044 Rowland Ave
- 1044 Rowland Ave Unit 35
- 1003 Tenbrook Place
- 1003 Tenbrook Place Unit 41
- 1026 Tenbrook Place
- 1012 Rowland Ave
- 1034 Tenbrook Place
- 1034 Tenbrook Place Unit 62