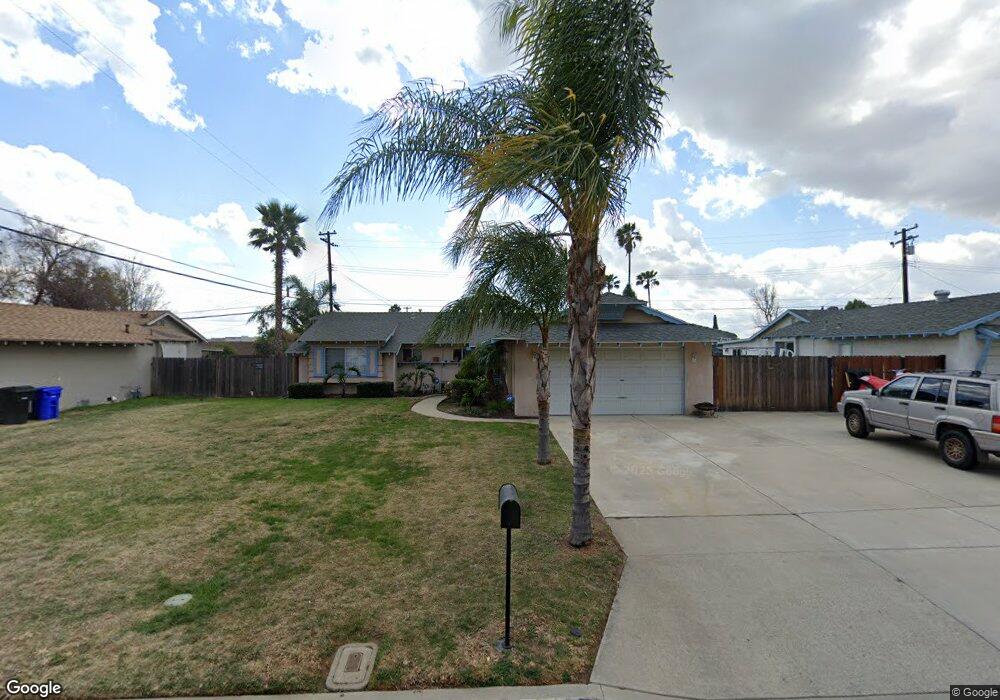
10275 Norwick St Rancho Cucamonga, CA 91730
Estimated Value: $647,764 - $715,000
3
Beds
2
Baths
1,263
Sq Ft
$542/Sq Ft
Est. Value
About This Home
This home is located at 10275 Norwick St, Rancho Cucamonga, CA 91730 and is currently estimated at $684,191, approximately $541 per square foot. 10275 Norwick St is a home located in San Bernardino County with nearby schools including Dona Merced Elementary, Ruth Musser Middle, and Rancho Cucamonga High School.
Ownership History
Date
Name
Owned For
Owner Type
Purchase Details
Closed on
Mar 23, 2019
Sold by
Macewen Tamara Leanne and Macewen Tamara
Bought by
Macewen Tamara Leanne
Current Estimated Value
Purchase Details
Closed on
Jun 28, 2005
Sold by
Macewen Michael E and Macewen Tamara
Bought by
Macewen Tamara
Home Financials for this Owner
Home Financials are based on the most recent Mortgage that was taken out on this home.
Original Mortgage
$296,100
Outstanding Balance
$153,568
Interest Rate
5.56%
Mortgage Type
New Conventional
Estimated Equity
$530,623
Purchase Details
Closed on
Nov 21, 1996
Sold by
Hunkins Robert
Bought by
Macewen Michael E and Macewen Tamara
Home Financials for this Owner
Home Financials are based on the most recent Mortgage that was taken out on this home.
Original Mortgage
$117,380
Interest Rate
7.59%
Mortgage Type
FHA
Create a Home Valuation Report for This Property
The Home Valuation Report is an in-depth analysis detailing your home's value as well as a comparison with similar homes in the area
Home Values in the Area
Average Home Value in this Area
Purchase History
| Date | Buyer | Sale Price | Title Company |
|---|---|---|---|
| Macewen Tamara Leanne | -- | North American Title Company | |
| Macewen Tamara | -- | Old Republic Title Company | |
| Macewen Michael E | $118,000 | Fidelity National Title |
Source: Public Records
Mortgage History
| Date | Status | Borrower | Loan Amount |
|---|---|---|---|
| Open | Macewen Tamara | $296,100 | |
| Closed | Macewen Michael E | $117,380 |
Source: Public Records
Tax History Compared to Growth
Tax History
| Year | Tax Paid | Tax Assessment Tax Assessment Total Assessment is a certain percentage of the fair market value that is determined by local assessors to be the total taxable value of land and additions on the property. | Land | Improvement |
|---|---|---|---|---|
| 2025 | $2,043 | $192,177 | $48,859 | $143,318 |
| 2024 | $2,043 | $188,409 | $47,901 | $140,508 |
| 2023 | $1,998 | $184,715 | $46,962 | $137,753 |
| 2022 | $1,965 | $181,093 | $46,041 | $135,052 |
| 2021 | $1,963 | $177,542 | $45,138 | $132,404 |
| 2020 | $1,907 | $175,721 | $44,675 | $131,046 |
| 2019 | $1,896 | $172,275 | $43,799 | $128,476 |
| 2018 | $1,842 | $168,897 | $42,940 | $125,957 |
| 2017 | $1,808 | $165,585 | $42,098 | $123,487 |
| 2016 | $1,786 | $162,339 | $41,273 | $121,066 |
| 2015 | $1,766 | $159,900 | $40,653 | $119,247 |
| 2014 | $1,713 | $156,768 | $39,857 | $116,911 |
Source: Public Records
Map
Nearby Homes
- 10288 Effen St
- 10375 Church St Unit 113
- 10375 Church St Unit 74
- 10113 Dorset St
- 10026 10026 Foothill Blvd
- 10591 Huxley Dr
- 7718 Haywood Place
- 7649 Dartmouth Ave
- 7803 Paxton Place
- 9967 Yew Ct
- 10487 Balsa St
- 9880 Madera Ct
- 7524 Matterhorn Ave
- 9854 Madera Ct
- 9822 Bianca Ct
- 9764 Louise Way
- 9929 Palo Alto St
- 8401 Sunset Trail Place Unit E
- 9706 Bodega Ct
- 8426 Western Trail Place Unit E
- 10287 Norwick St
- 10265 Norwick St
- 10276 Effen St
- 10266 Effen St
- 10253 Norwick St
- 10276 Norwick St
- 10288 Norwick St
- 10254 Effen St
- 10266 Norwick St
- 10243 Norwick St
- 10254 Norwick St
- 10244 Effen St
- 10279 Effen St
- 10275 Ashford St
- 10269 Effen St
- 10287 Ashford St
- 7914 Center Ave
- 10265 Ashford St
- 10244 Norwick St
- 10231 Norwick St